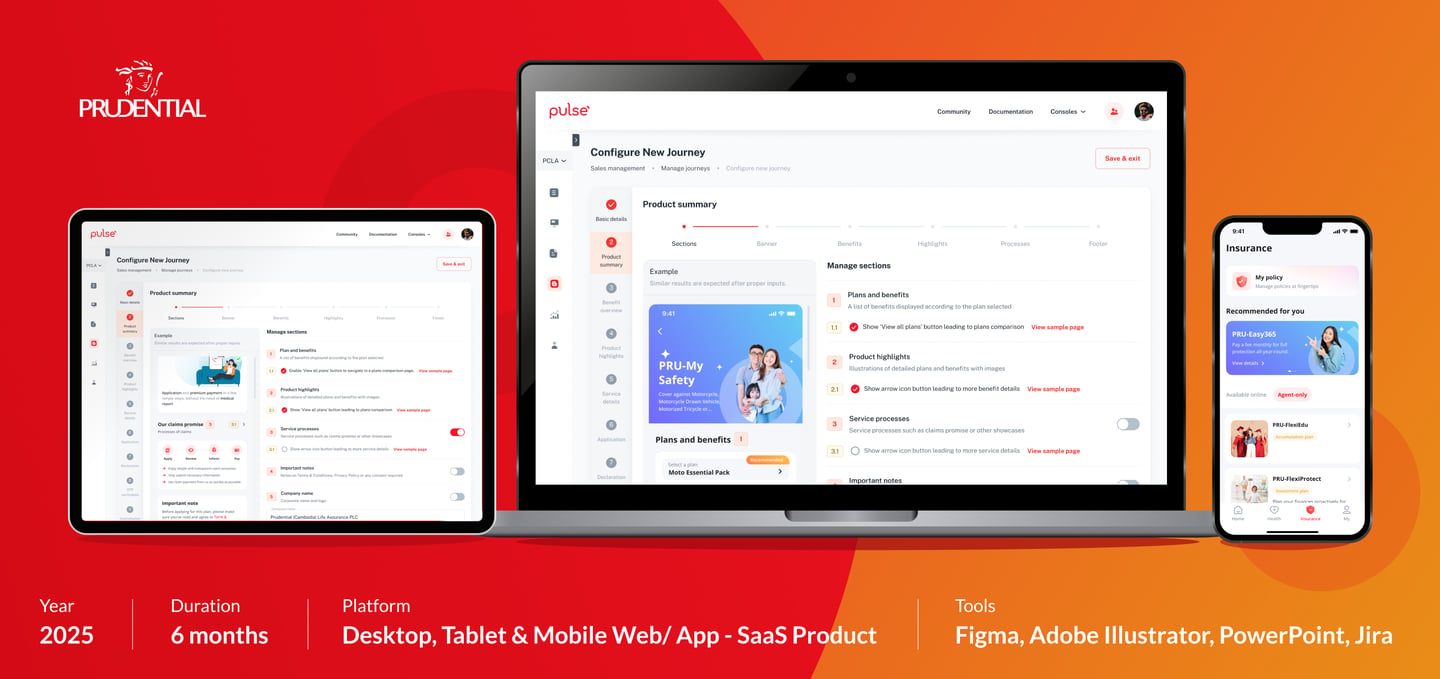
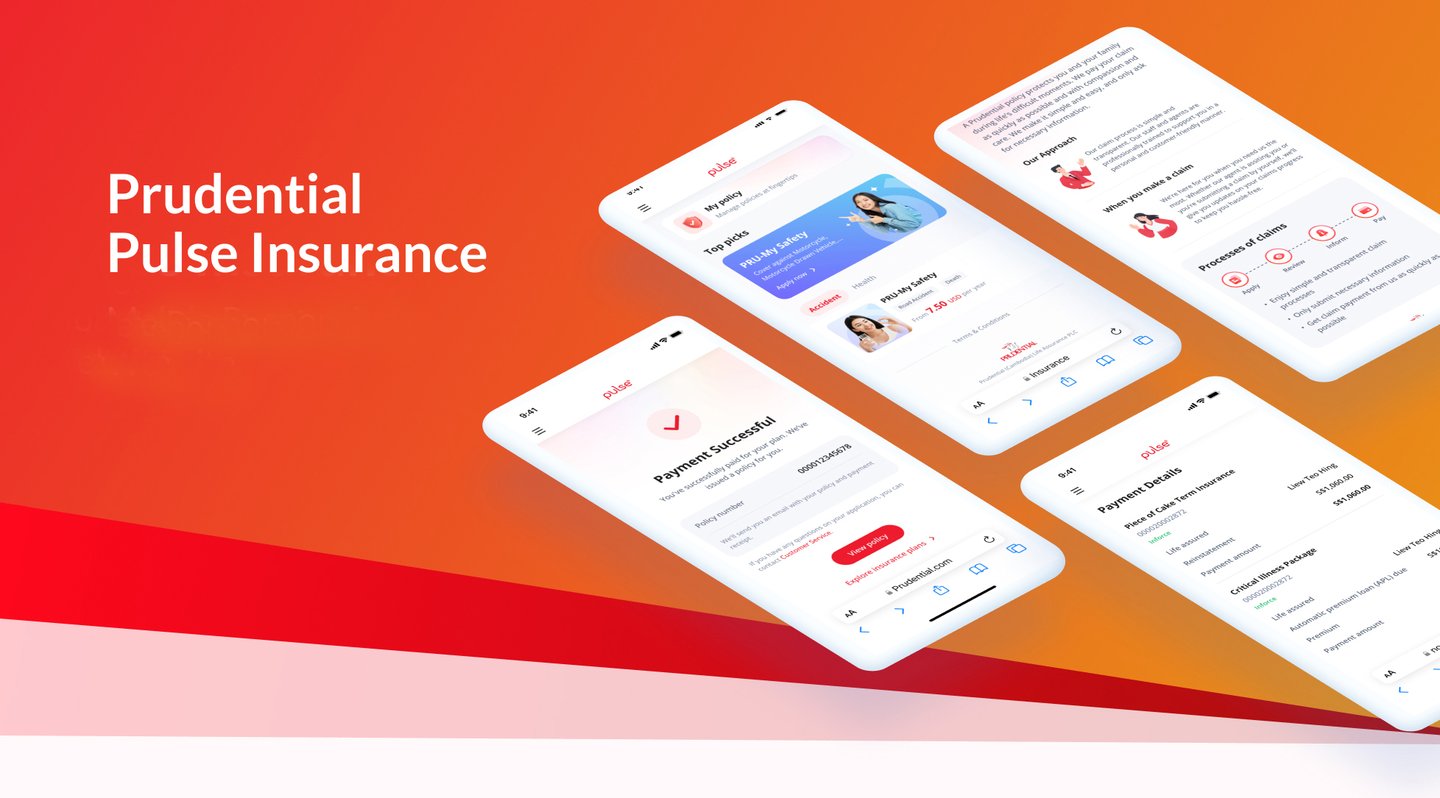
Prudential Sales Management (SaaS)
The platform supports Local Business Units (LBU) Sales, Marketing, Operations, and Sales Experience teams in creating personalised mobile pages for insurance product promotion.
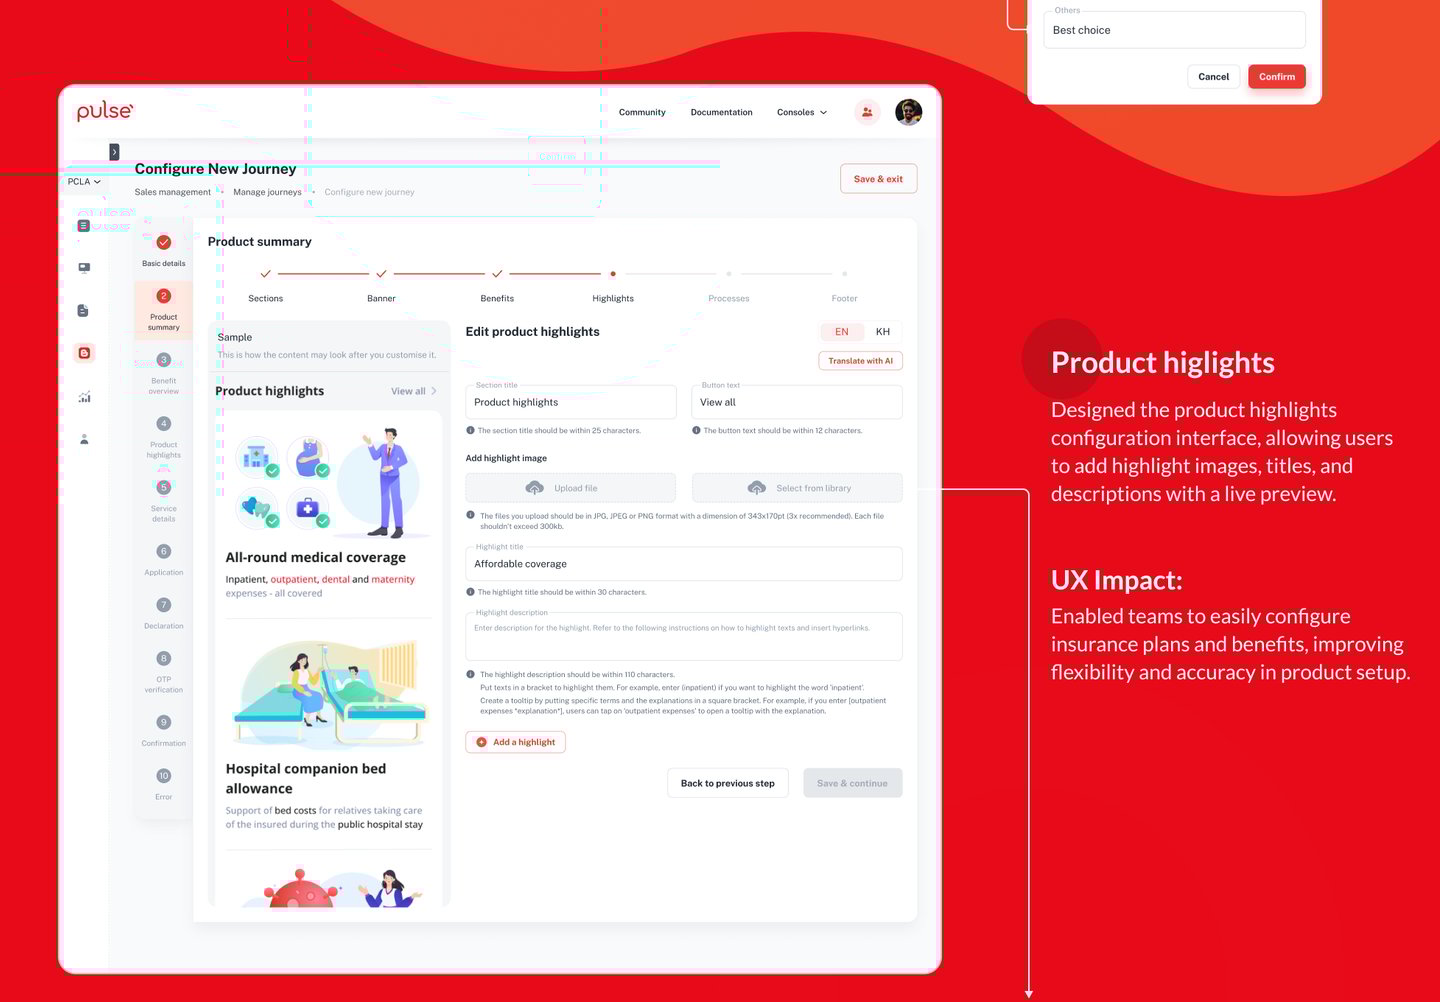
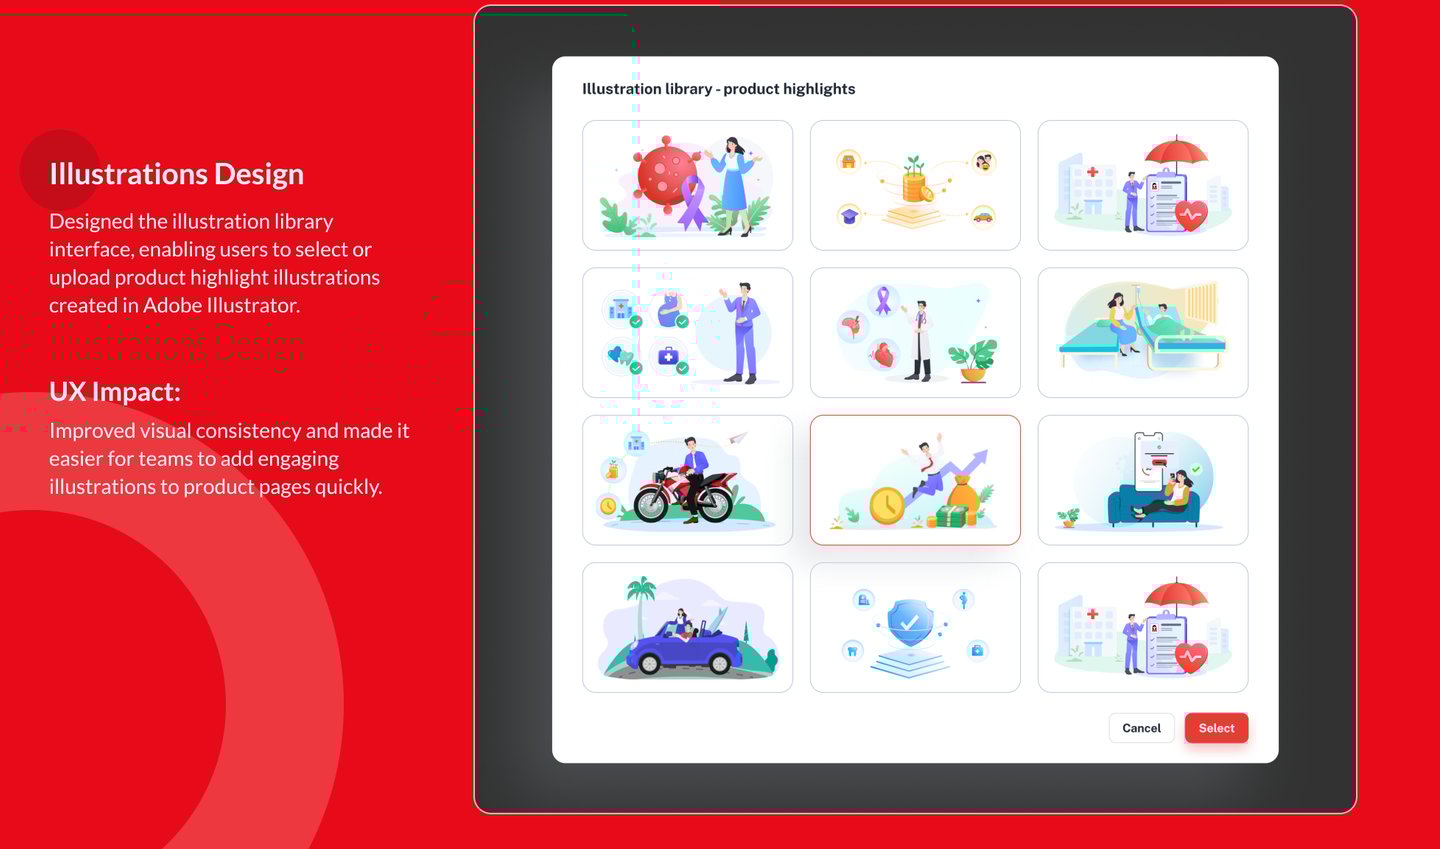
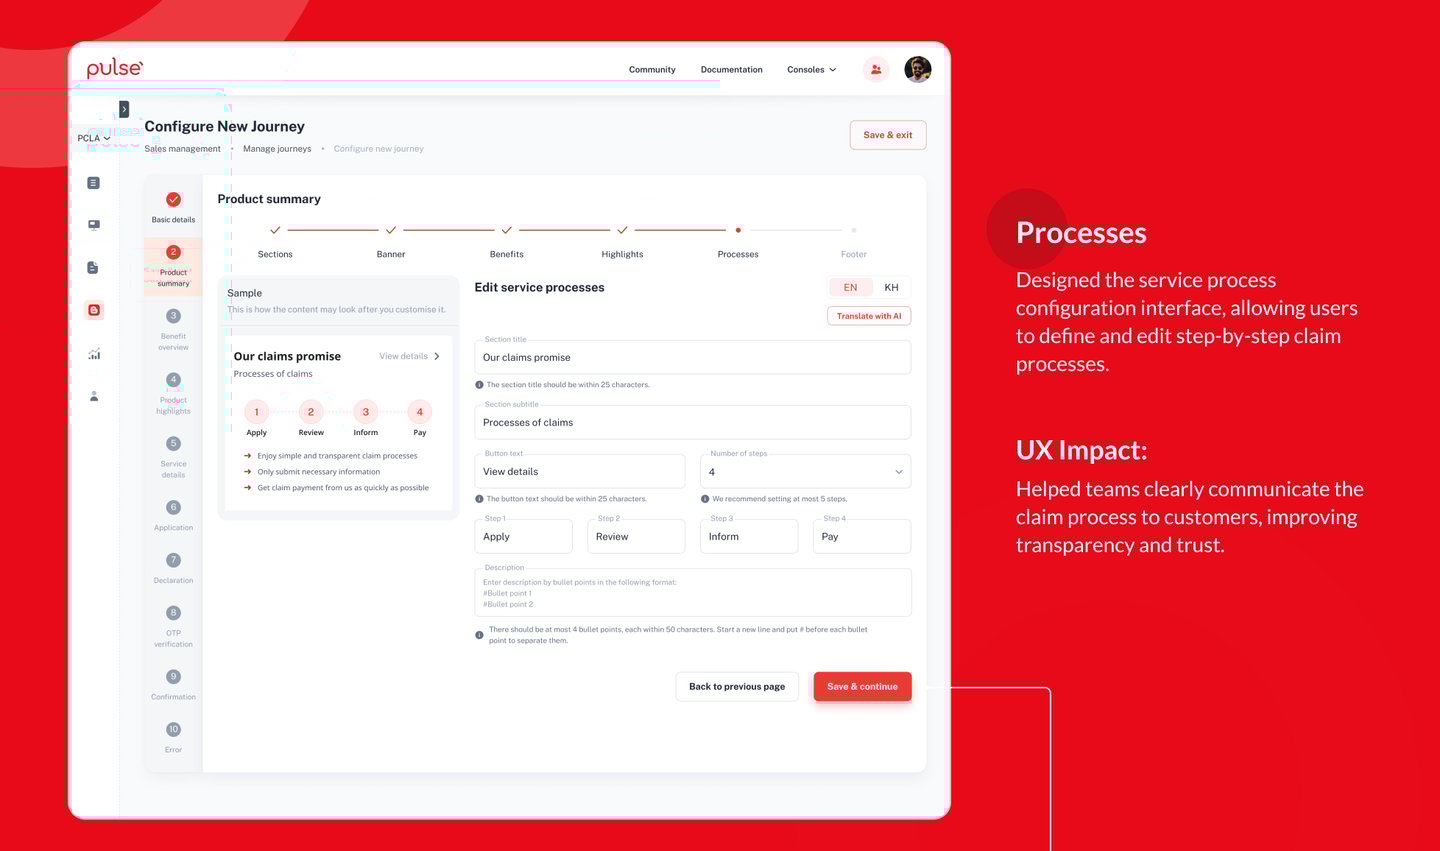
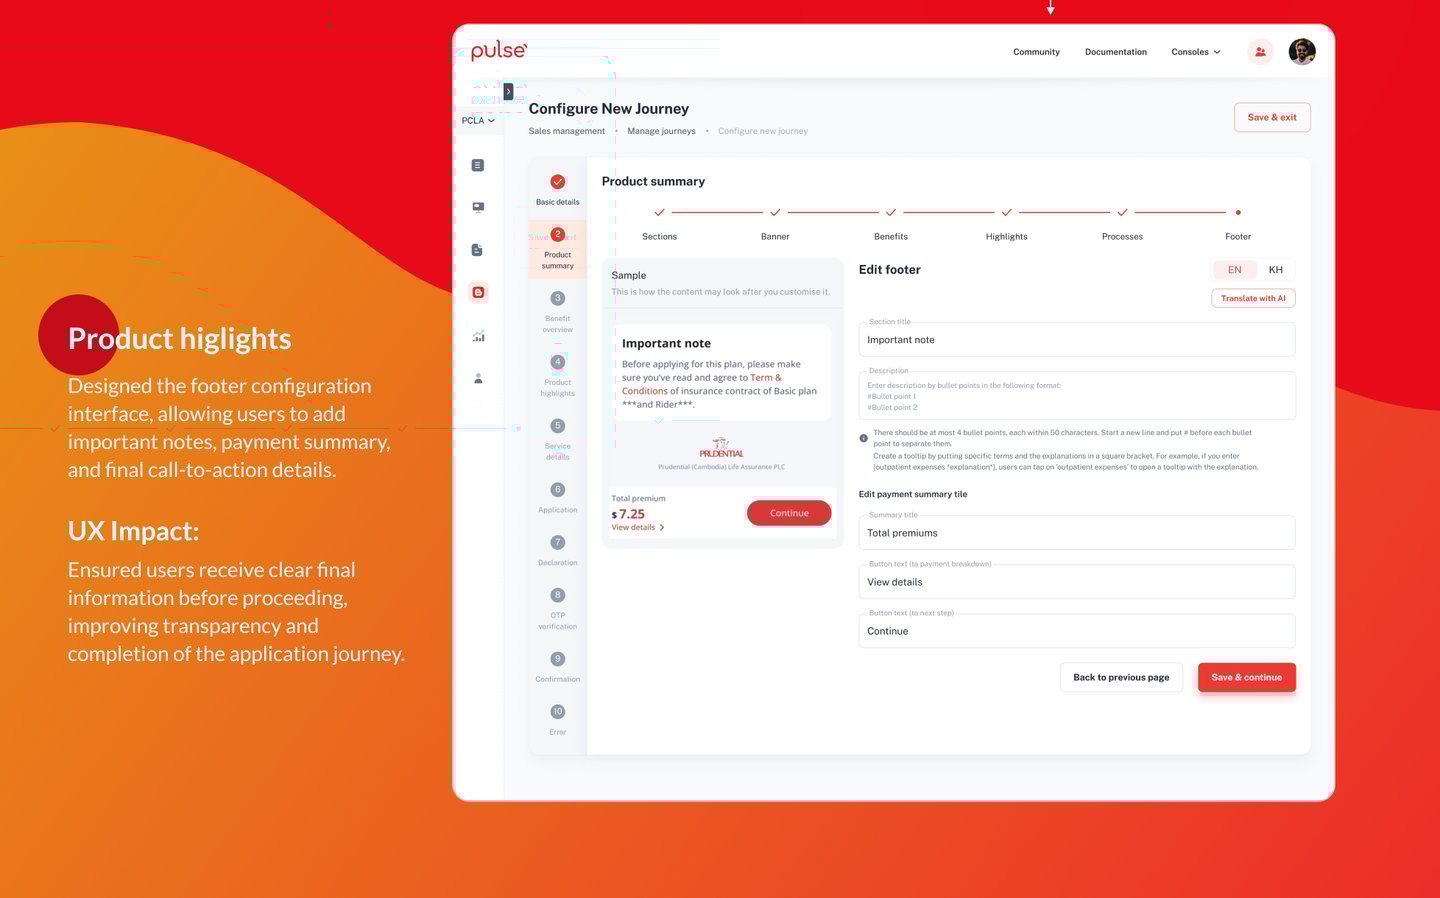
(Insurance Product Configuration (For All Business Unit)
Maintenance Management | Expense Tracking | Multi-Boat Management | Financial Insights & Statistics | Document & Record Storage
Year:
2025
Industry:
Insurance
Project Duration:
6 months
Product Designed:
From scratch level
My Responsibilities:
UX research | User flows | Wireframes | Interaction design | Design System | Visual design | Collaboration with PM & engineers
Platform:
Desktop & Mobile
Role:
Lead the project as a UX/UI with a junior Visual Designer
(Case Study)
OVERVIEW
Empowering Cross-Functional Teams
The platform supports Local Business Units (LBU) Sales, Marketing, Operations, and Sales Experience teams in creating personalised mobile pages for insurance product promotion.Seamless Content Customization
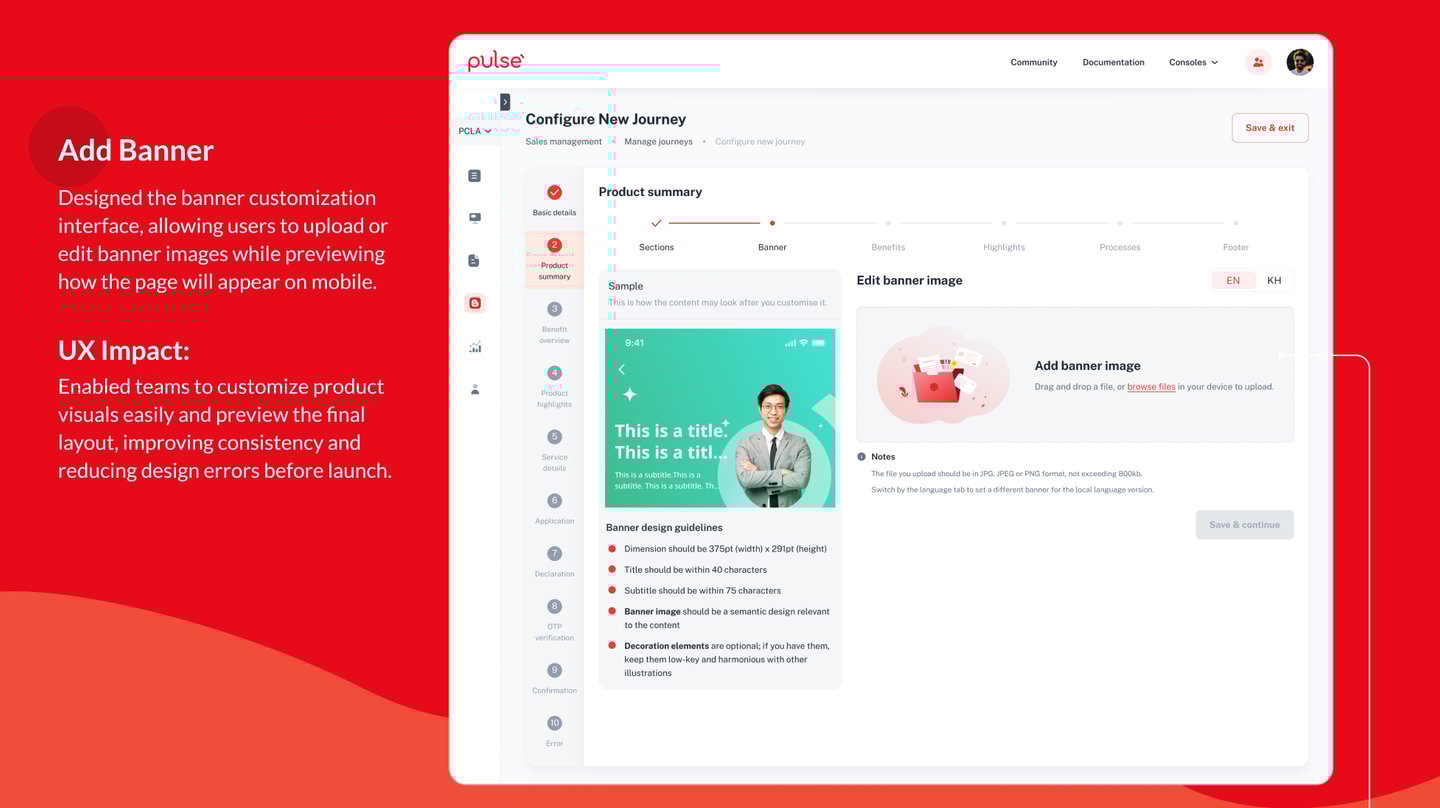
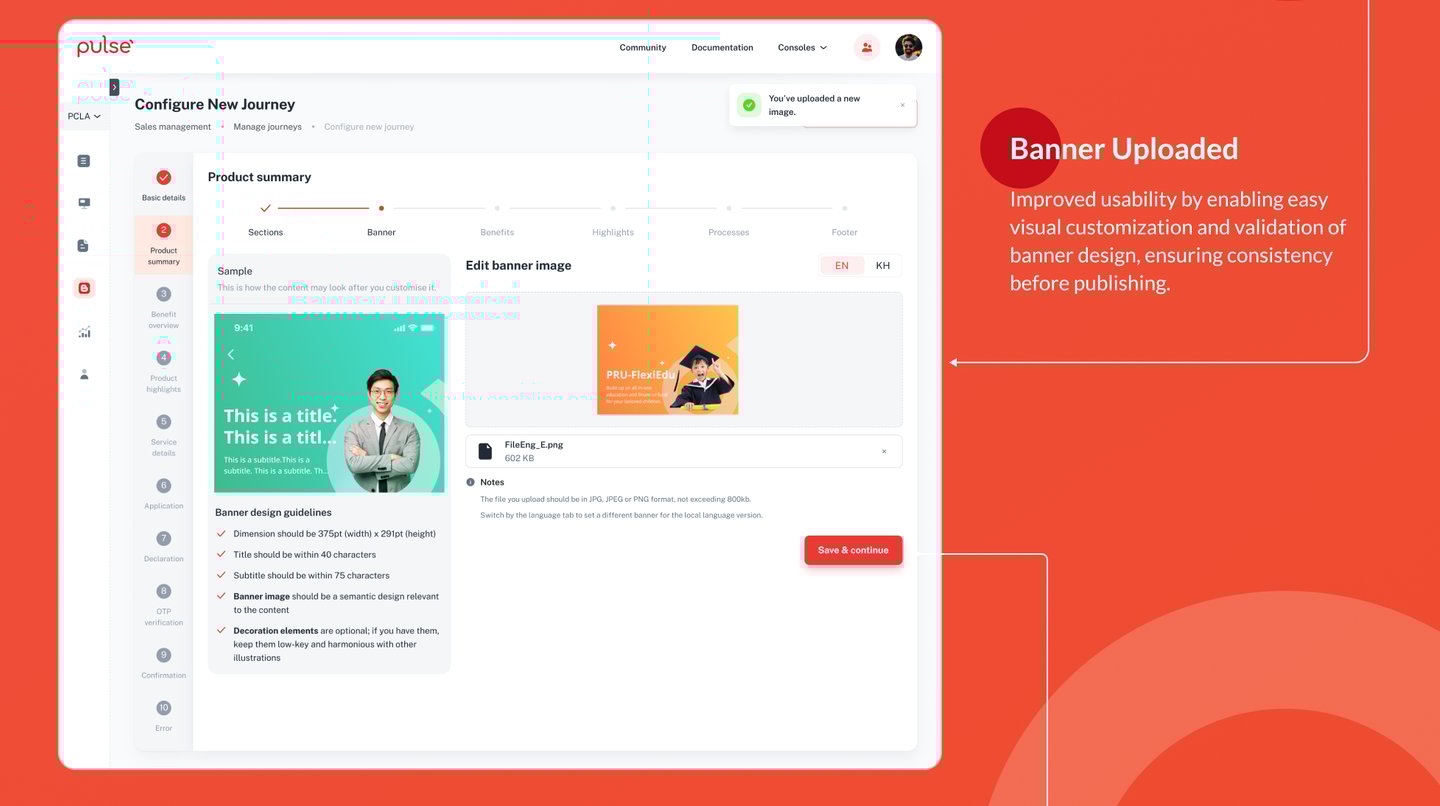
Users can easily upload banners and integrate key insurance business details to craft tailored sales content.Mobile-First Experience
Designed with a mobile-first approach, it allows teams to engage users through responsive, visually consistent interfaces.Improved Sales Engagement
By customizing content for different audiences, teams can better connect with potential clients and boost interaction.Optimized for Business Outcomes
The streamlined presentation of offerings helps drive conversions, improve user satisfaction, and maintain a competitive edge in the market.

BUSINESS REQUIREMENTS
UX STRATEGY
It aligns design with business goals and user needs, ensuring a seamless experience.
It drives innovation and fosters continuous improvement across platforms.

PROBLEM
There is no single platform where the business, sales, and product teams execute their plan.
No product management online platform exists where users can see transparent progress enabling LBUs to launch or withdraw products based on their marketing plan.
There is no digital platform where users can review product sales and analyse user conversion of each distribution channel.
User wants flexibility in managing thier insurance policies and payments.

Insurance sales advisors struggle to efficiently manage leads, access relevant sales content, and track customer interactions across fragmented systems. This leads to increased cognitive load, slower sales cycles, and missed revenue opportunities, ultimately impacting both advisor productivity and customer experience.
CHALLANGES
Lack of Centralised Platform: Fragmented workflows and inefficient communication due to the absence of a unified system.
Limited Visibility: Sales and marketing teams struggled to track product configuration progress.
Complex Journeys: Legacy systems caused complicated user experiences, needing simplification.
Scalability Issues: Balancing customization and standardization for diverse LBU needs.
Data Gaps: Lack of actionable insights for informed decision-making.
Resistance to Change: Users were hesitant to adopt new digital systems.
Stakeholder Alignment: Managing diverse expectations across multiple teams.
SOLUTION
Centralized Platform: Developed a unified system for seamless product configuration and collaboration.
Enhanced Visibility: Added real-time dashboards for progress tracking and performance insights.
Simplified UX: Designed intuitive interfaces to reduce complexity and improve user adoption.
Scalable Design: Built flexible components to meet diverse LBU needs.
Data Insights: Integrated analytics for actionable sales and user behavior insights.
Change Support: Offered training and resources to ease the transition.
Stakeholder Alignment: Conducted workshops and feedback sessions for continuous collaboration.
Qualitative
(Empathy & Deep Understanding)
No centralised platform for sales teams to configure and track insurance products.
Lack of transparency in product launch and management.
Manual processes slow down product setup and approvals.
Need for faster product configuration with predefined templates and automated workflows.
Sales teams struggle to access real-time performance metrics to track user conversion and engagement.
User Interviews: Conducted 13 in-depth interviews with insurance agents, sales teams, and product managers to understand their pain points.
Contextual Inquiry: Observed how sales teams currently configure and sell insurance products.
Focus Groups: Engaged different departments (sales, marketing, and operations) to identify cross-functional challenges.
Key Insights
Quantitative
(Pain Points & Needs)
(Data-Driven Validation)
Survey: Collected data from 250+ users to identify usability challenges and workflow inefficiencies.
Analytics Review: Assessed existing sales data to understand drop-off points in the product setup process.
Key Findings
80% of users want an intuitive, self-service product setup experience.
65% of sales teams report delays due to approval dependencies.
40% increase in sales conversion when users have access to real-time product performance data.
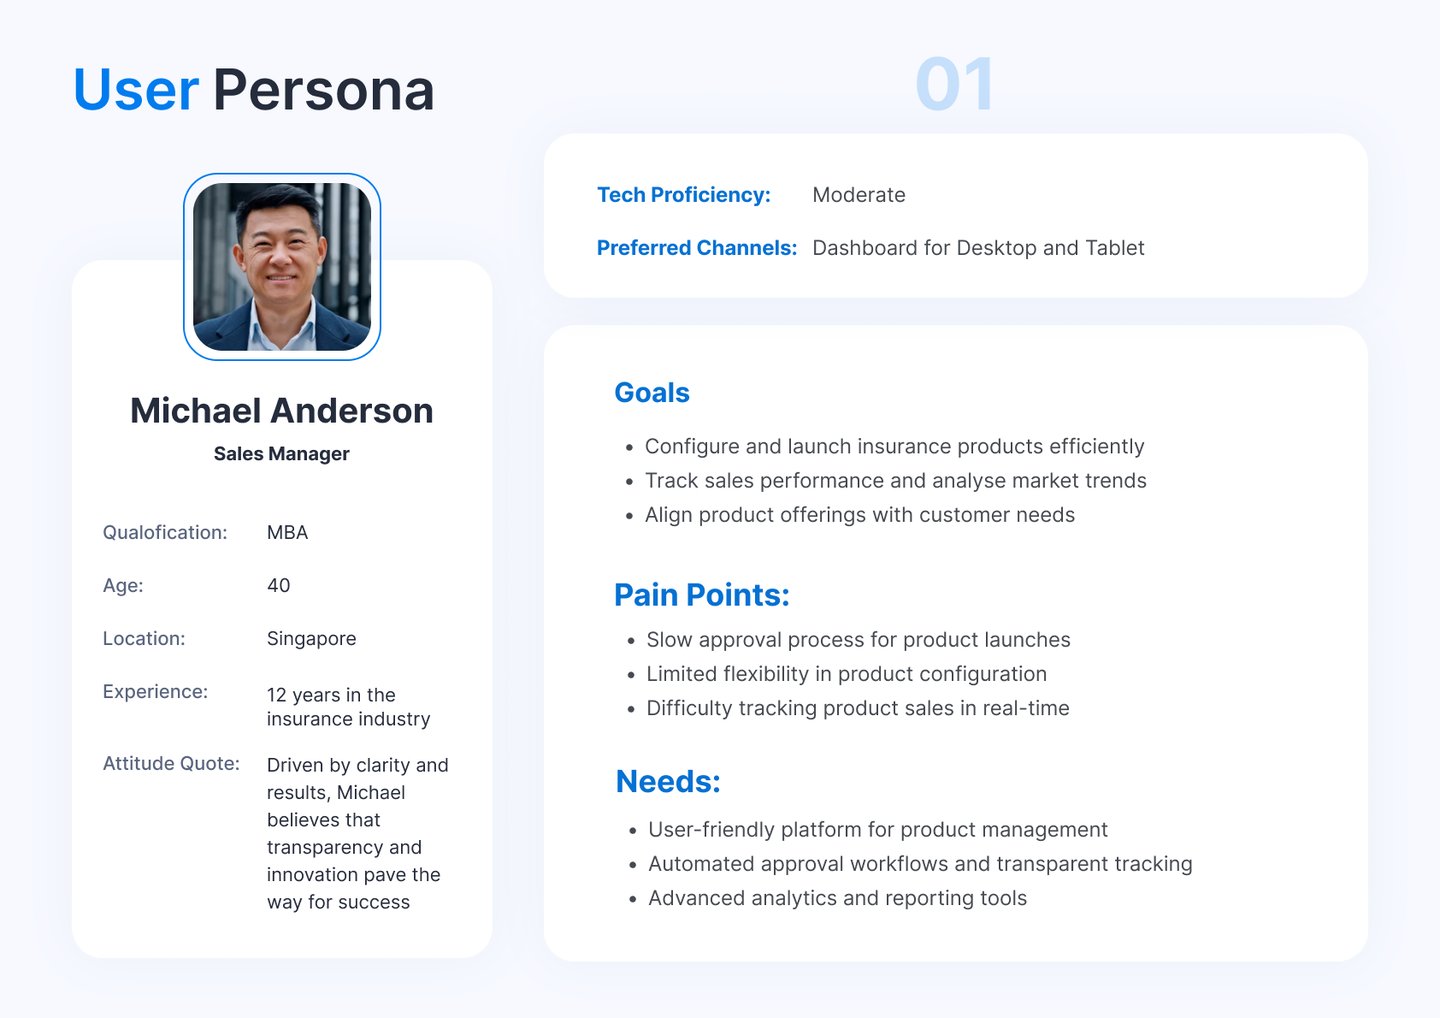
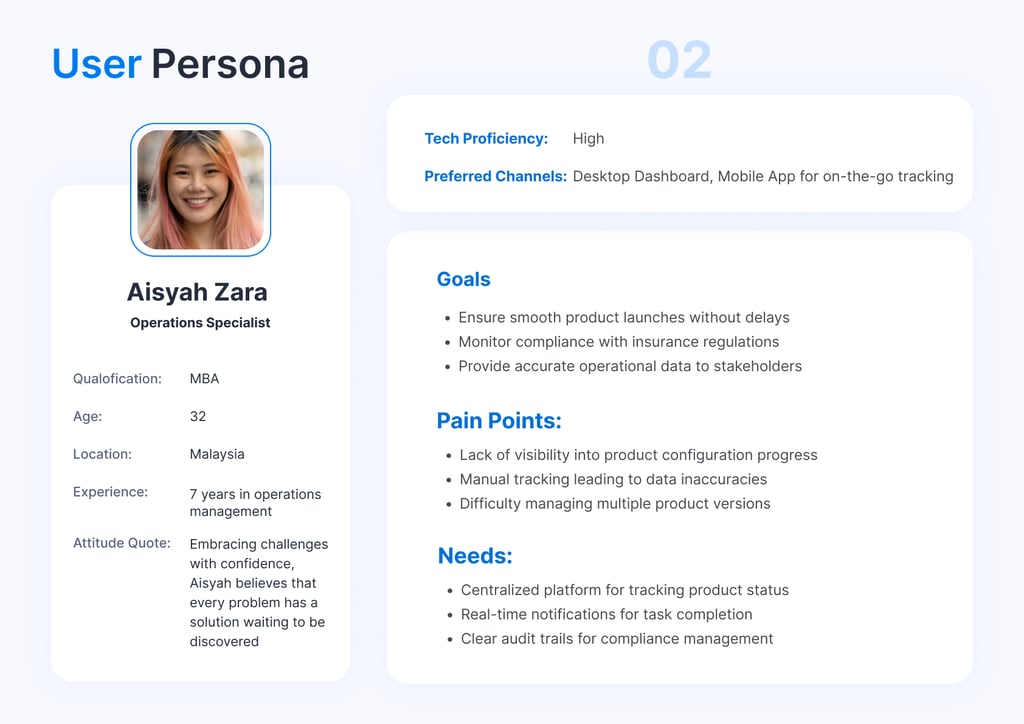
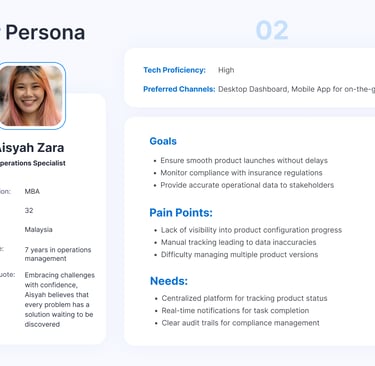
USER RESEARCH
Target Users
Male and Female ages 20 to 60 older, South Asian.
LBU Sales, Operational team, Insurance agents, Business Leads and more

Competitor Analysis
To ensure Prudential’s Sales Management (Insurance Product Configuration) platform remains competitive, we analysed key players in the insurance technology space. The focus was on their product offerings, user experience, features, and differentiators.
Ease of Configuration: Competitors like MetLife offer low-code solutions. Prudential can leverage drag-and-drop product setup to simplify configuration.
Automation & AI: AI-driven recommendations and automated workflows can improve efficiency, similar to UNM’s AI-driven insights.
User Experience: Simplifying product setup and integrating real-time analytics will enhance usability, making the platform more competitive.
Customisation & Scalability: While competitors offer enterprise-level solutions, Prudential can focus on flexibility for mid-sized and large insurers.
Competitive Insights & Opportunities
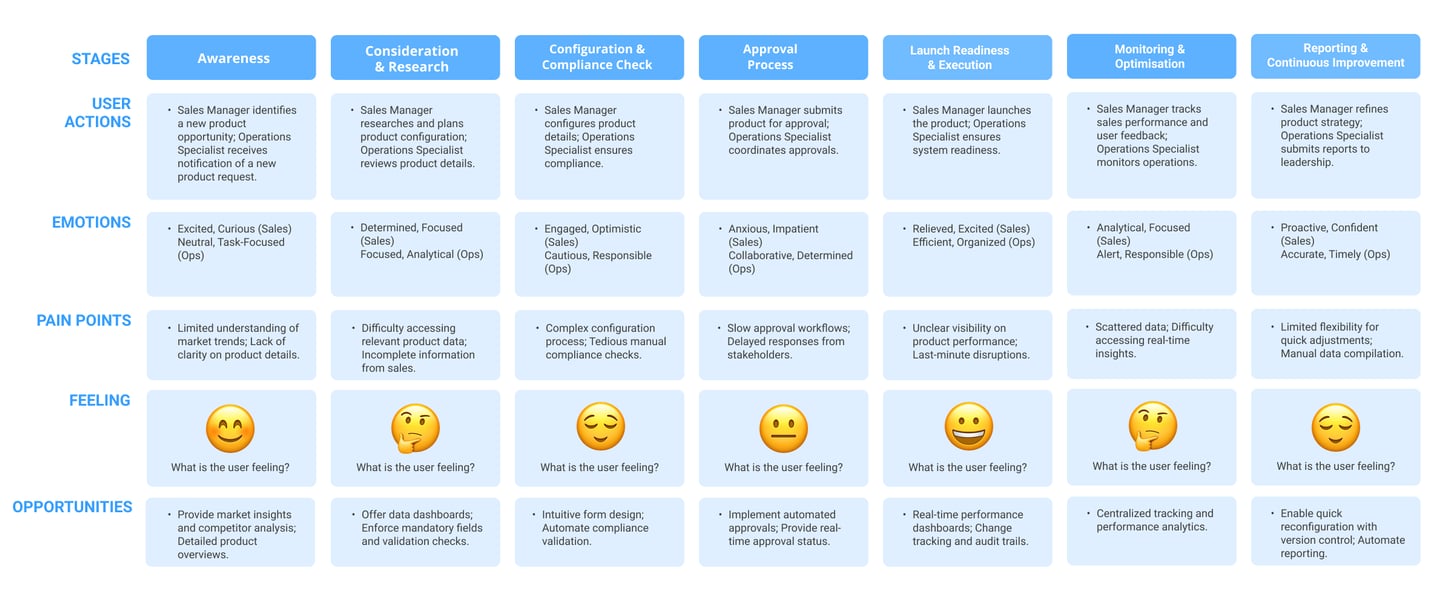
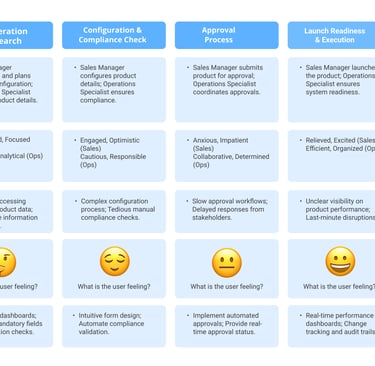
USER JOURNEY MAP
User journey mapping visualizes a user's interactions with a product or service, highlighting pain points and opportunities for improvement.
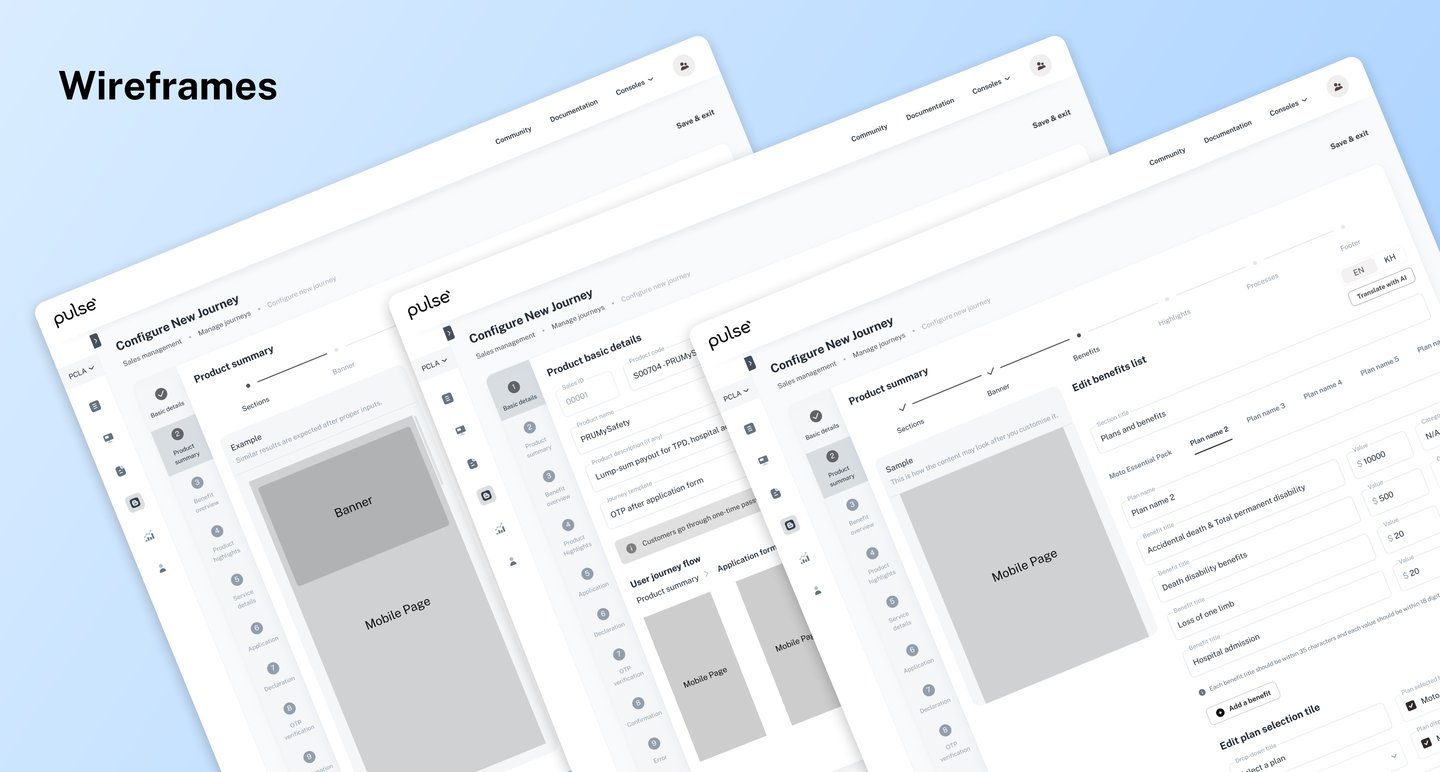
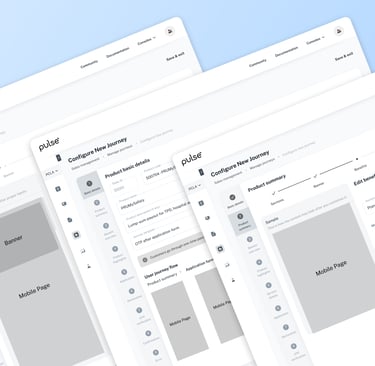
Starting the Design
Paper Prototypes
Low-Fidelity Prototype
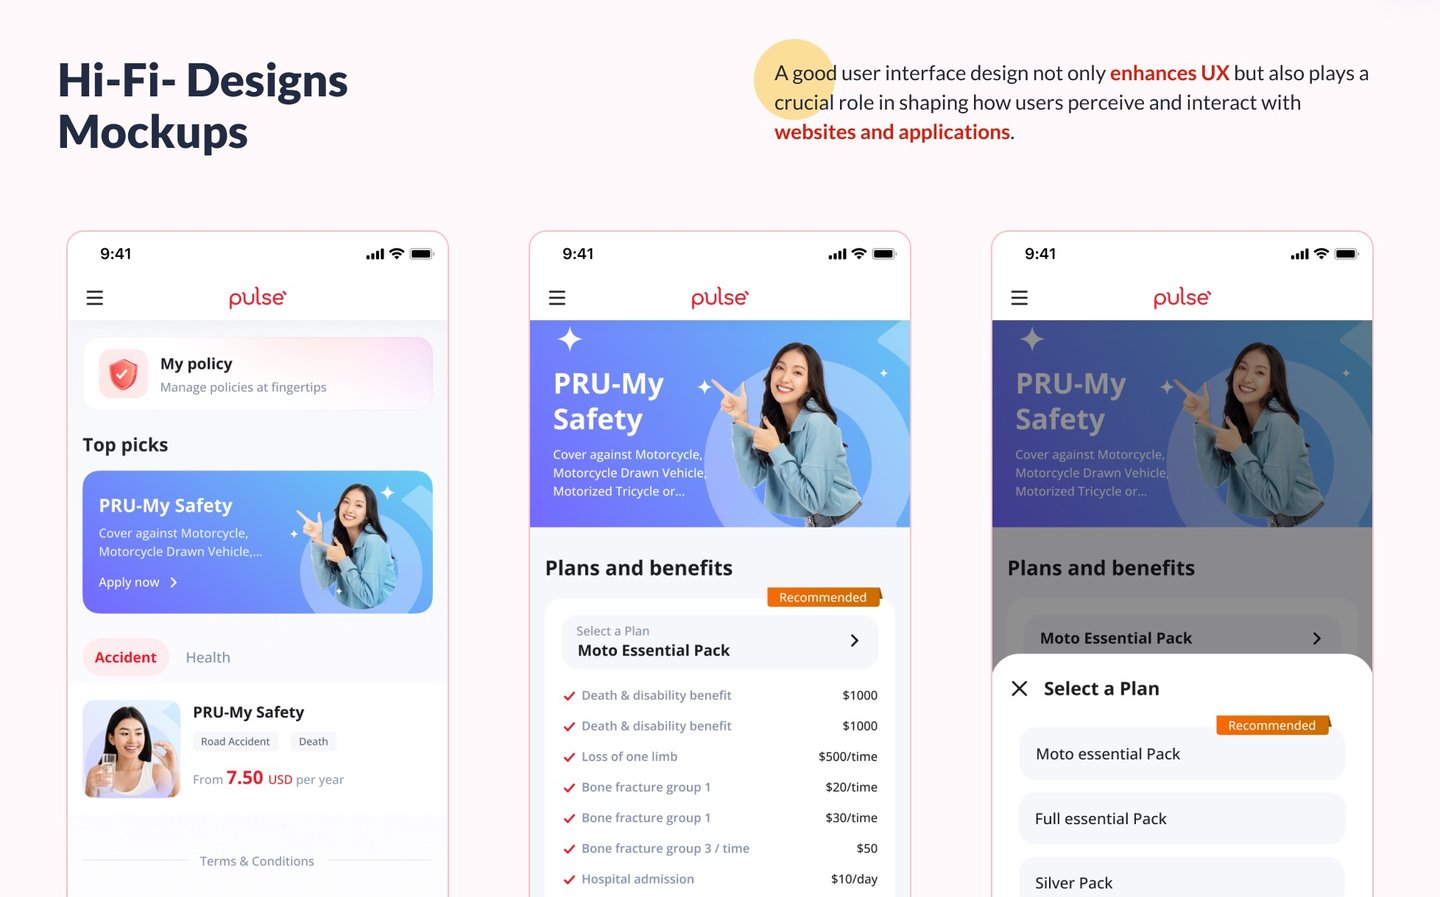
High-Fidelity Prototype
Usability studies

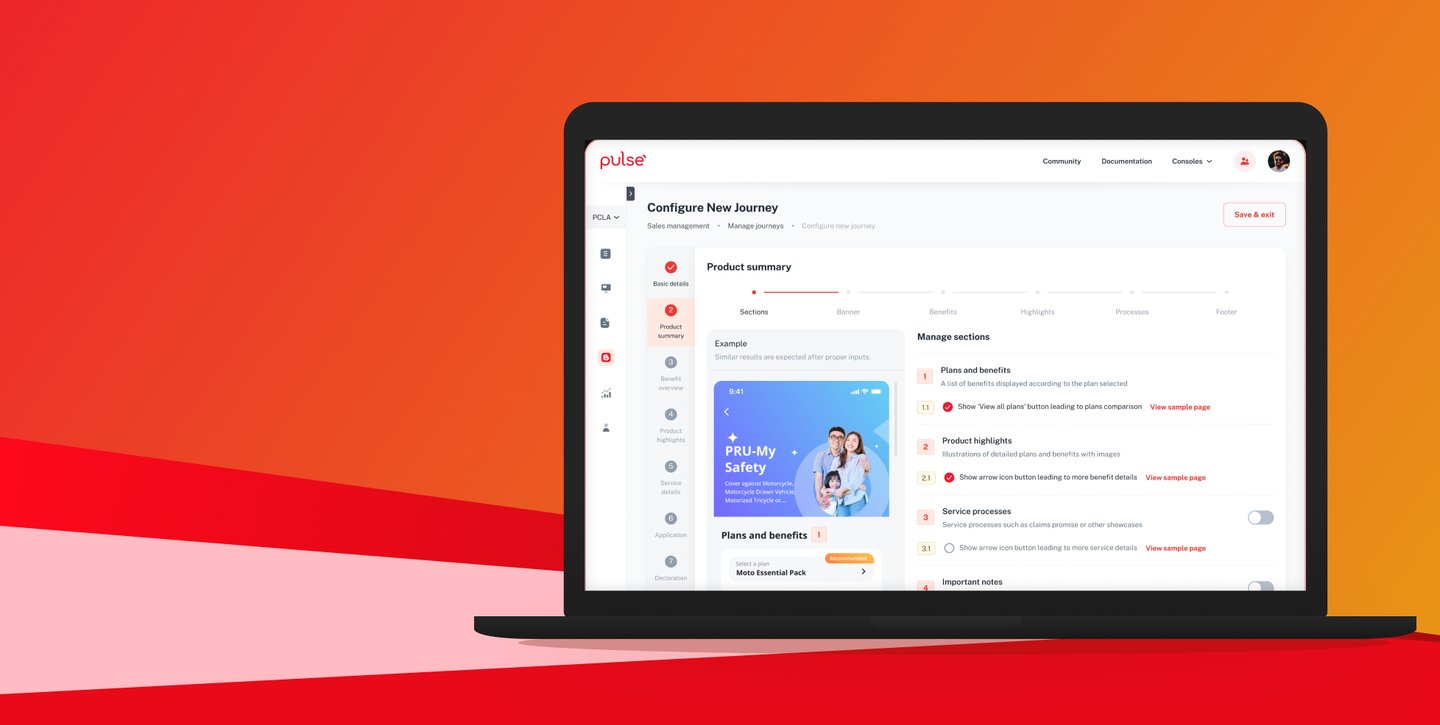
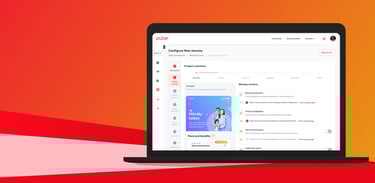
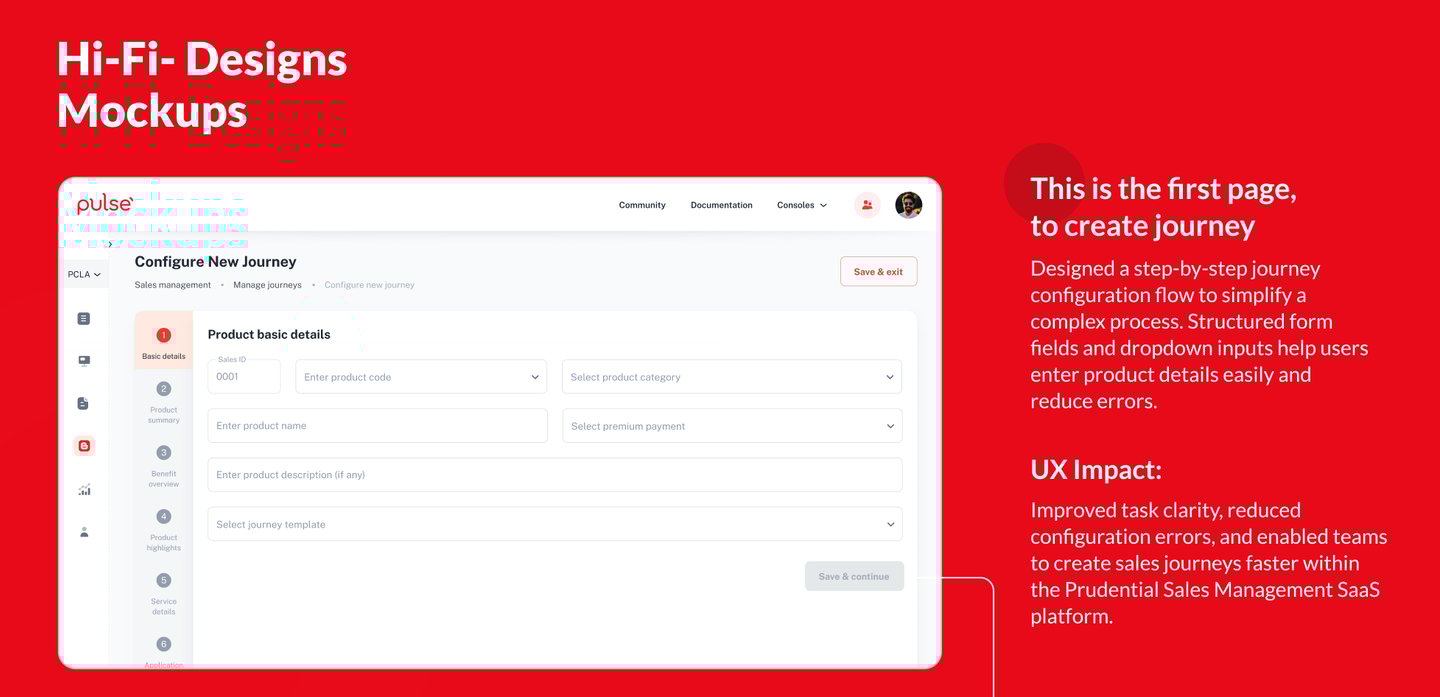
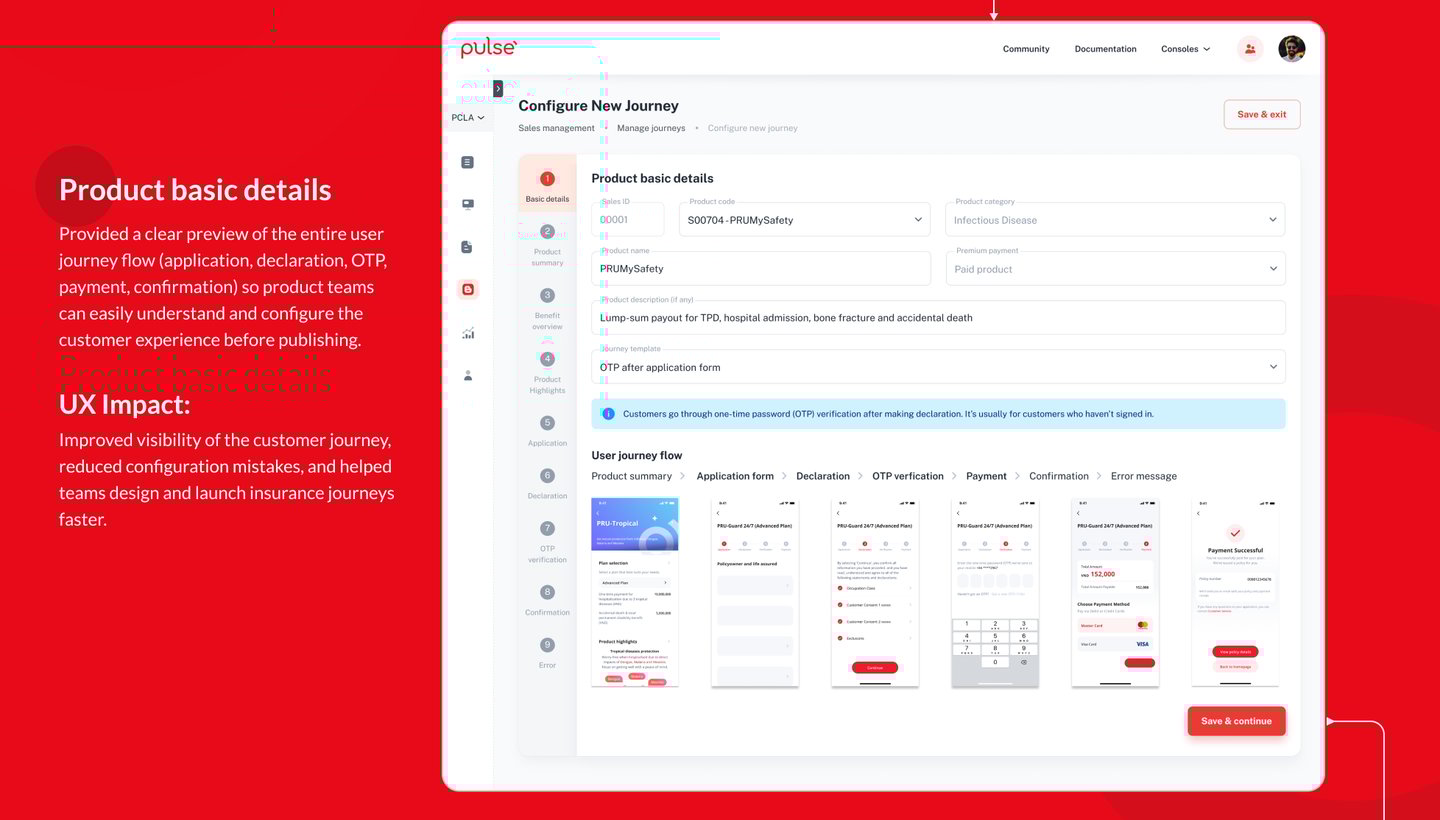
Pulse SaaS Products
Prototype
A final UX prototype is a near-final version of a digital product or interface that is ready to be handed off to the development team. It is an interactive model that simulates the user experience and is used to validate the design concept before the final product is released.
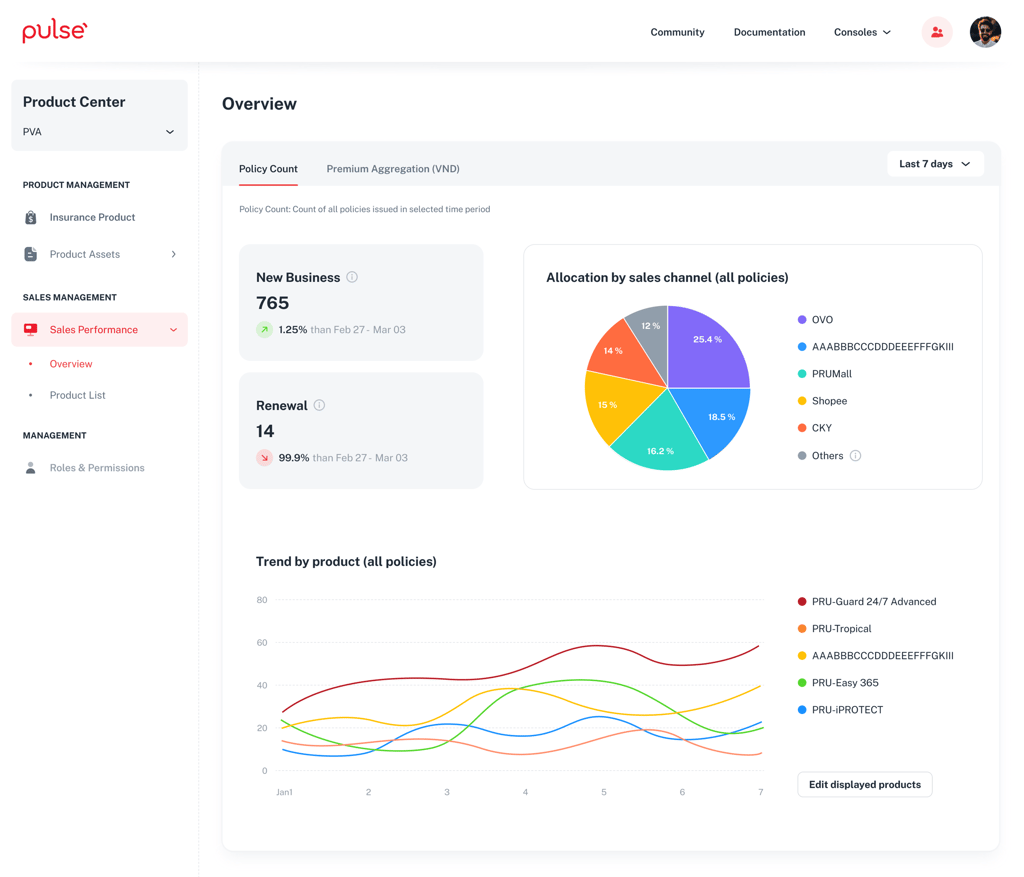
Sales Performance Dashboard
The Prudential Sales Performance Dashboard provides a centralized, data-driven solution for tracking and analyzing sales performance. By offering real-time insights, user conversion metrics, and distribution channel analysis, the dashboard empowers sales teams to make informed decisions, optimize strategies, and drive business growth. With its intuitive interface and actionable analytics, it enhances efficiency and ensures better alignment between sales goals and market demands.
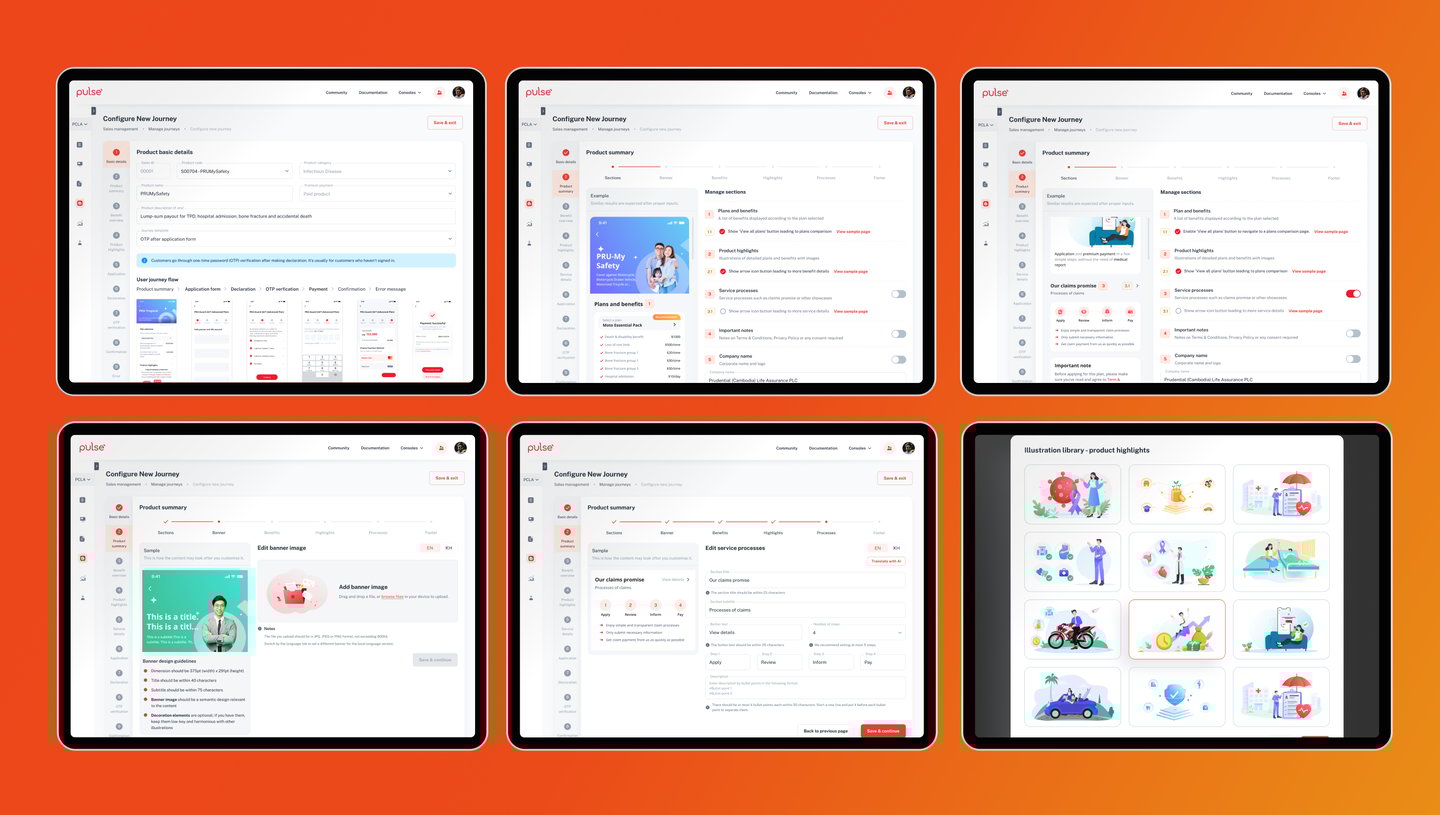
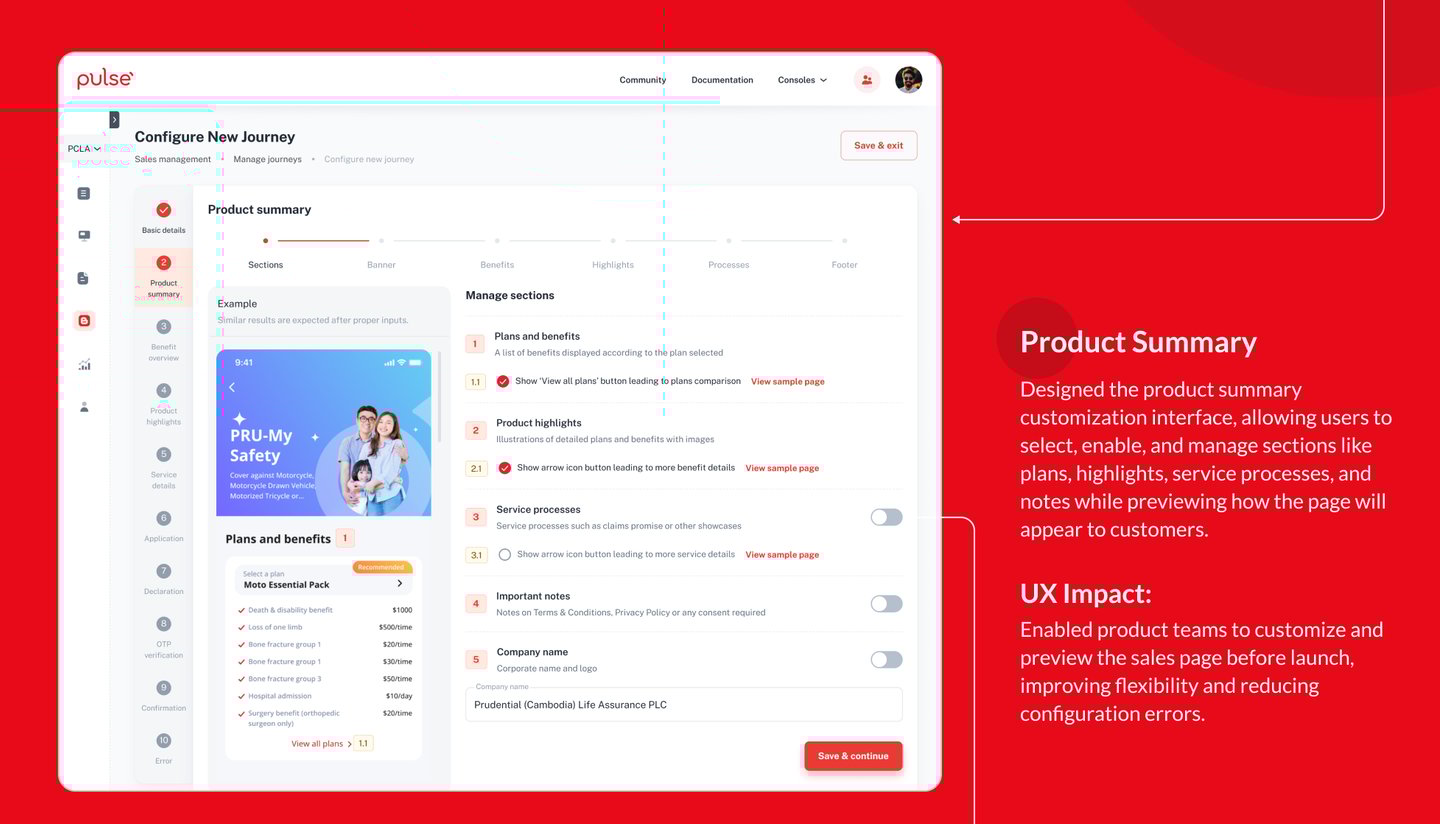
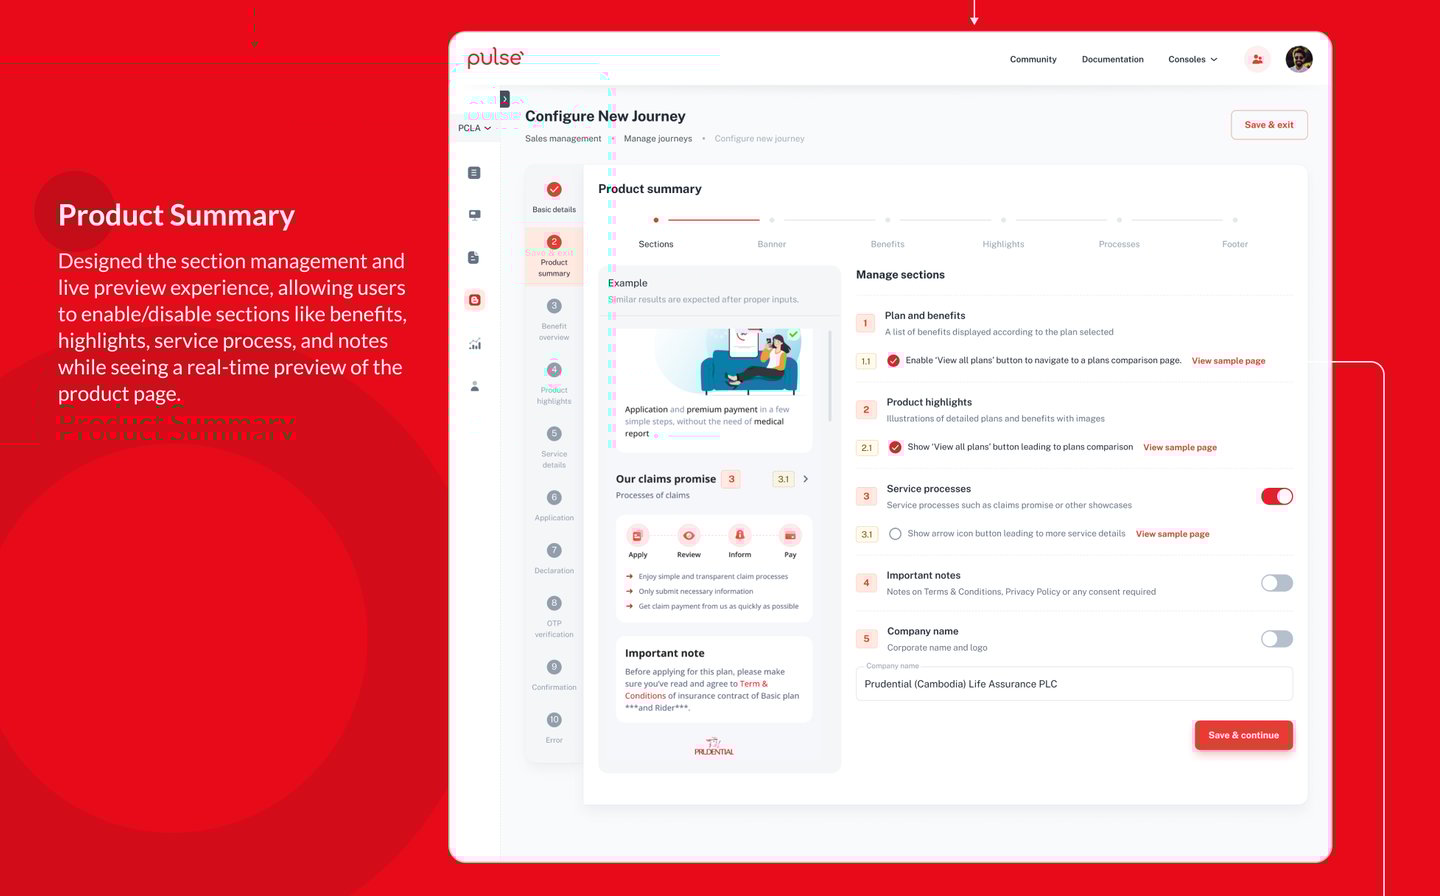
iPad and tablet design is essential for Insurance Product Configuration SaaS to support agents during client meetings and on-site consultations. It enables quick, touch-friendly access to complex plan setups, boosting efficiency and professionalism.
Designed for iPad/Tablet


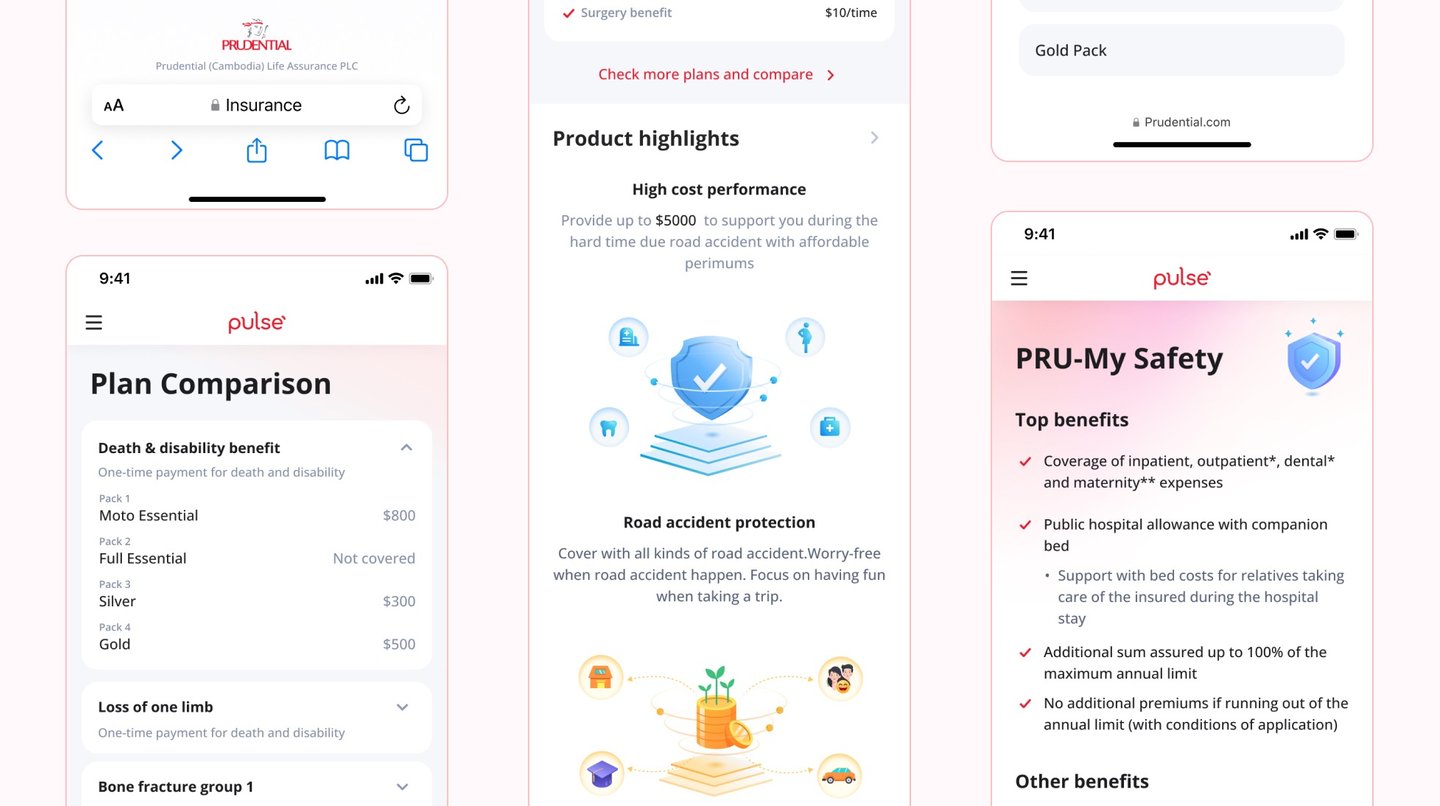
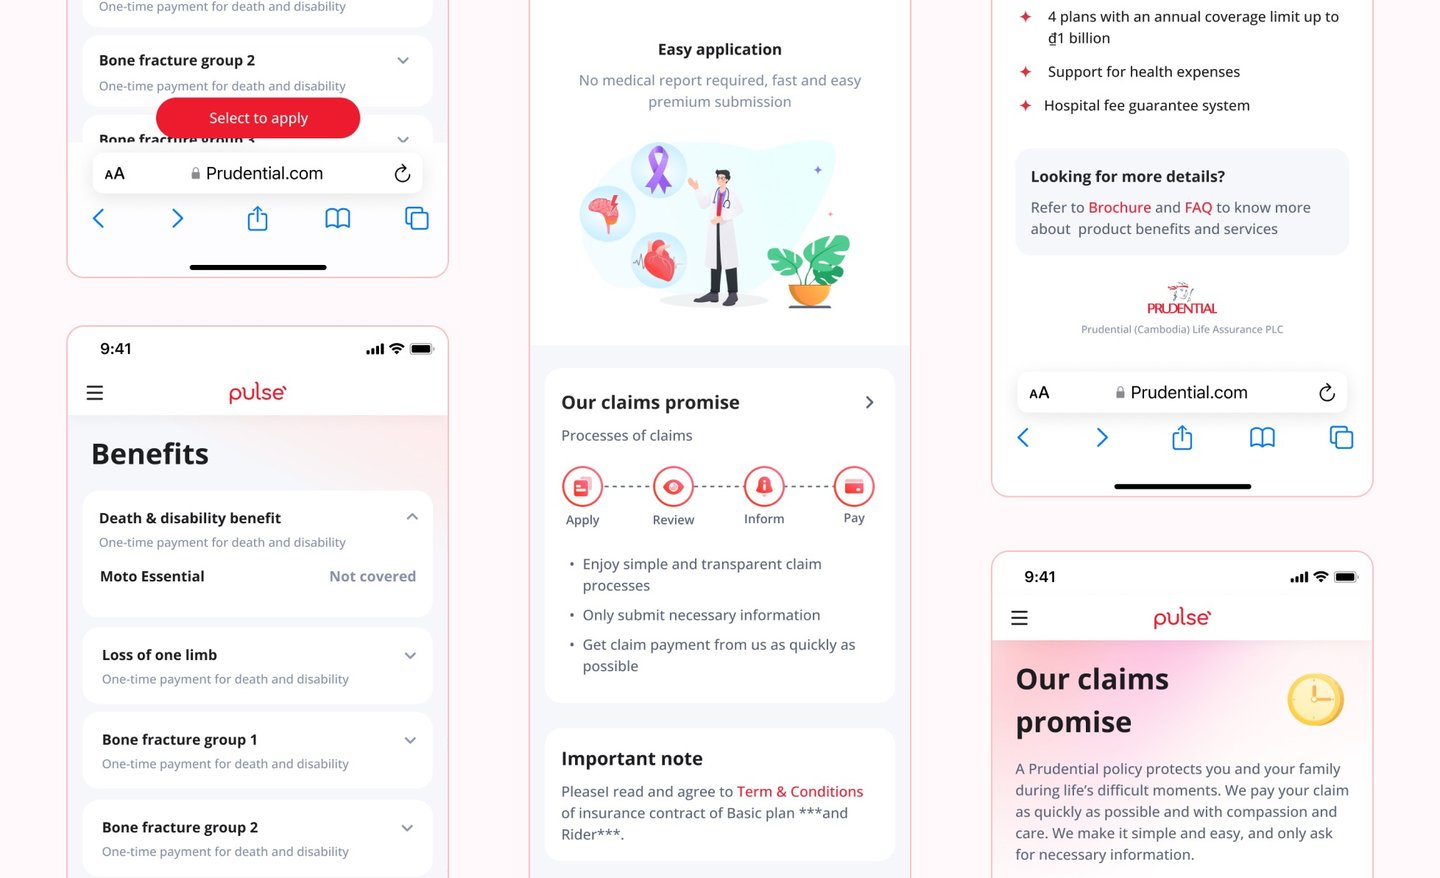
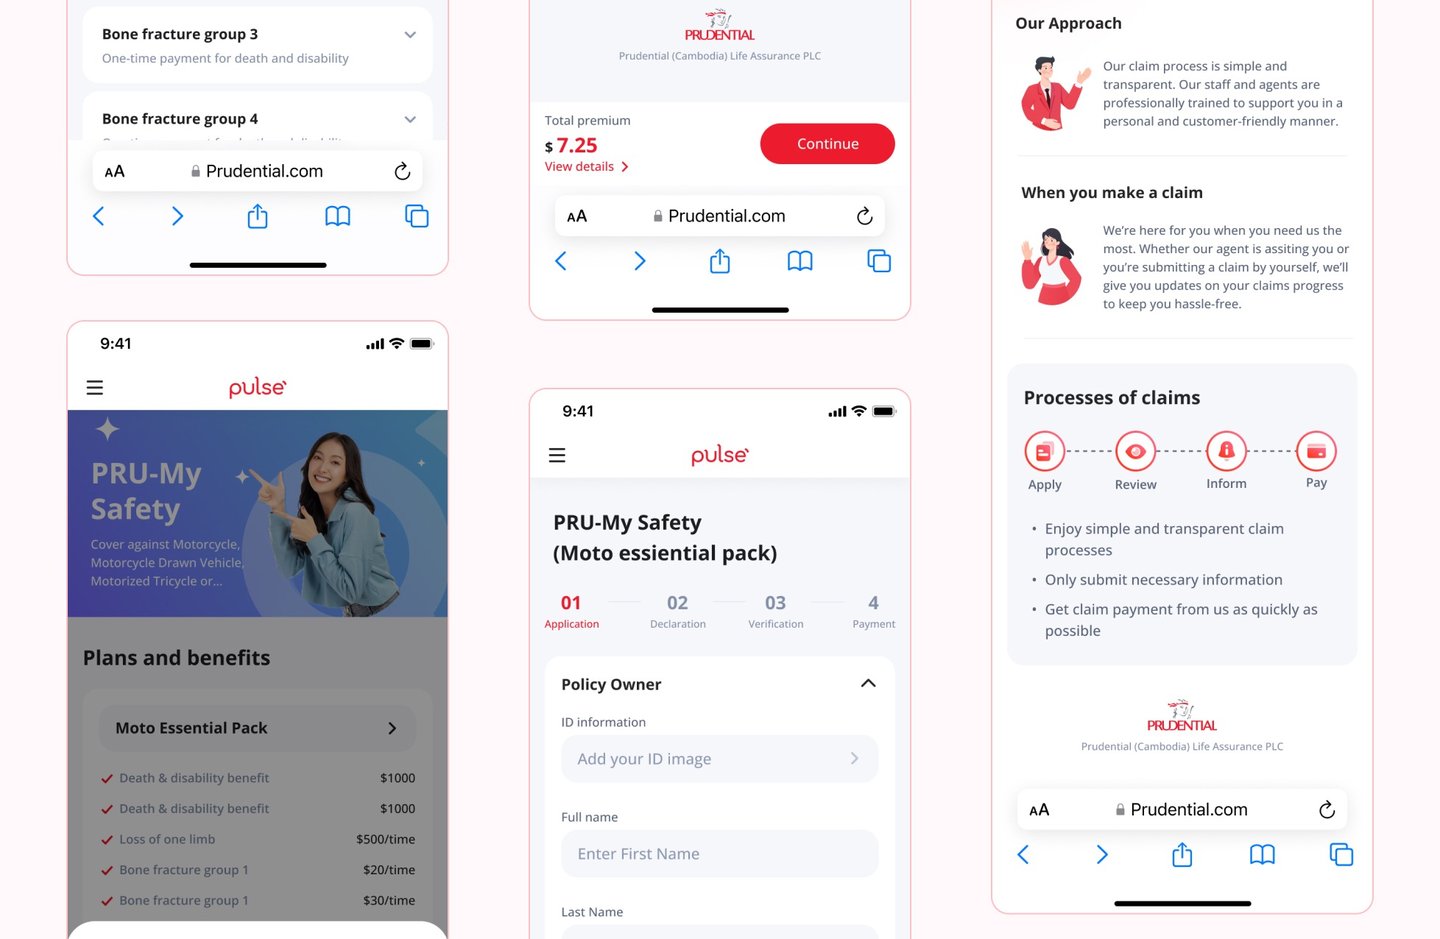
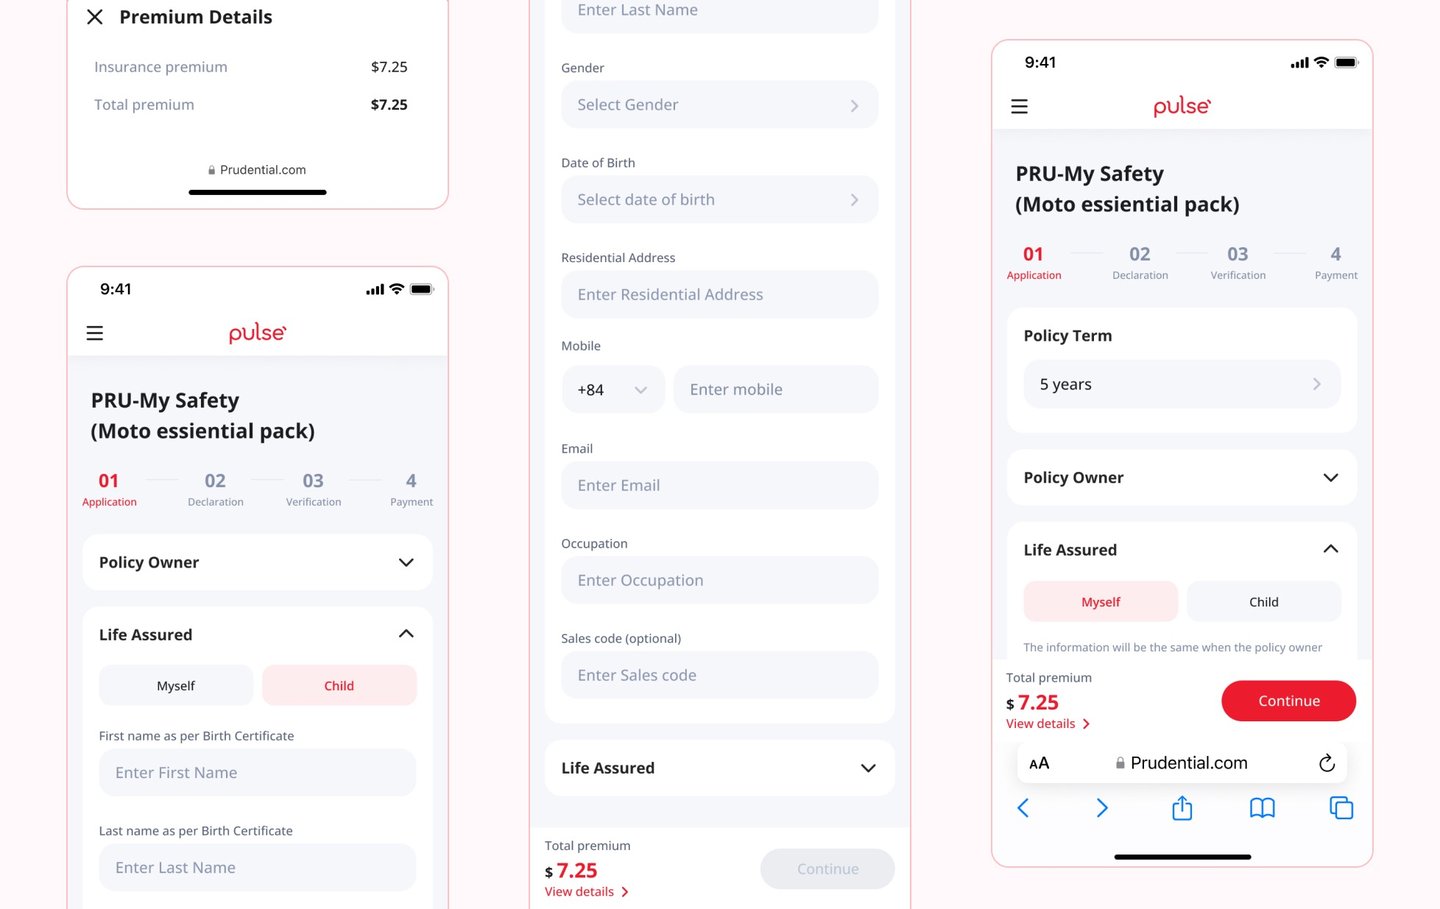

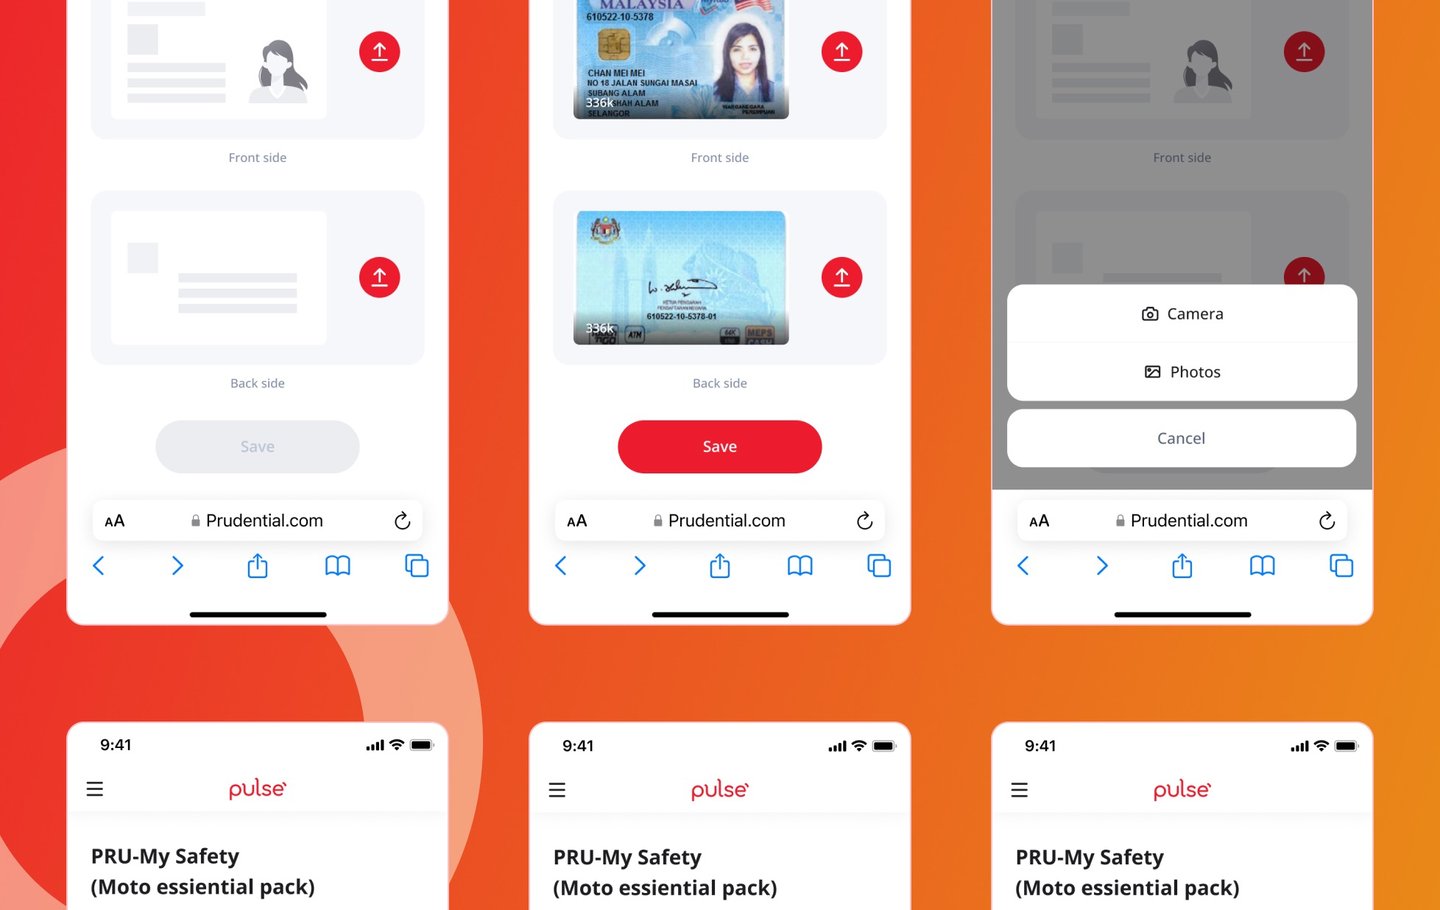


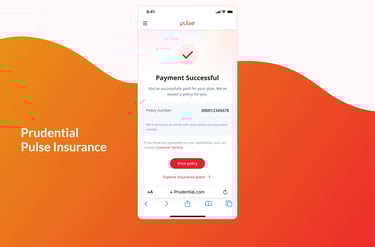
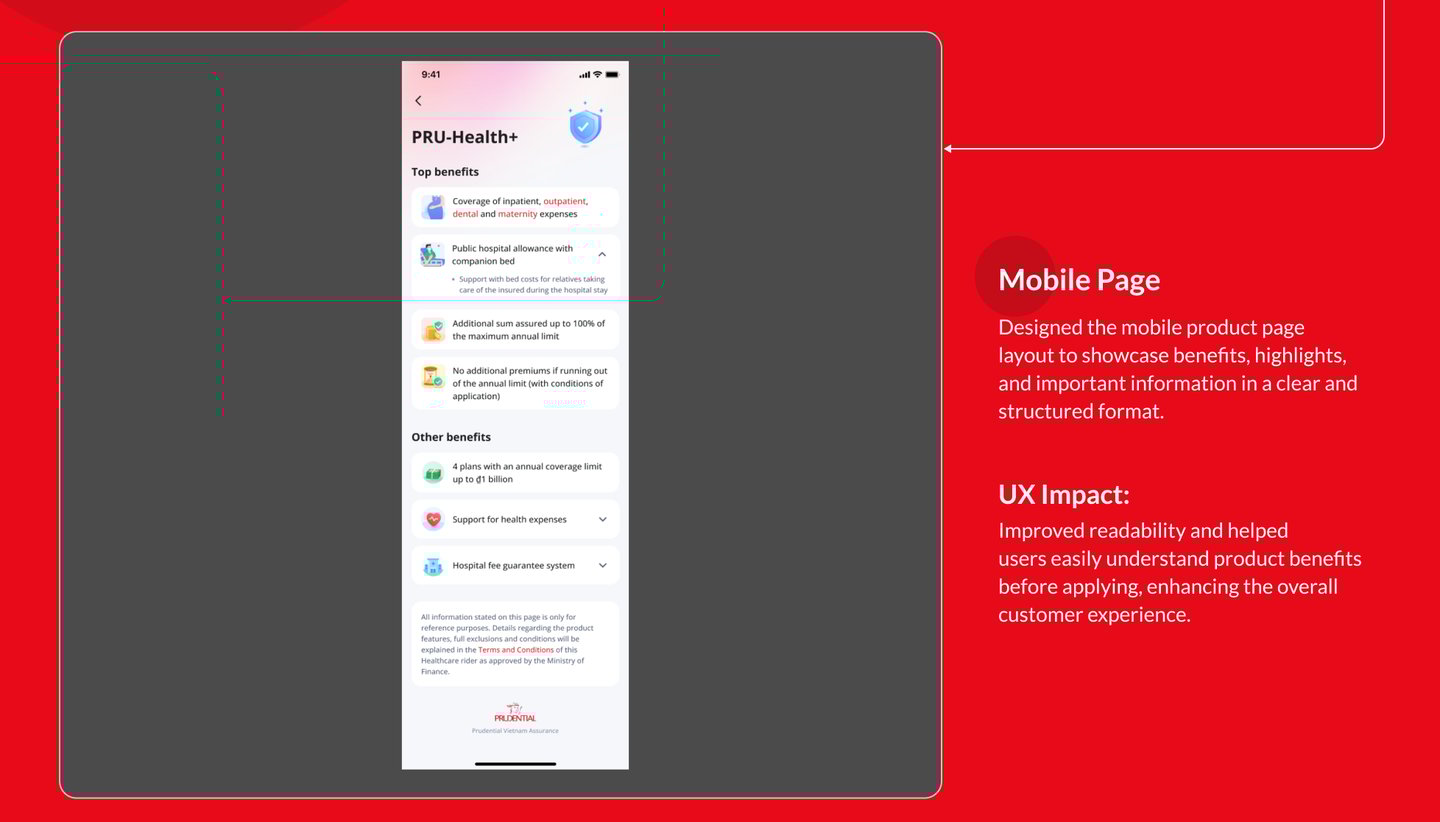
Mobile View (Web/App)
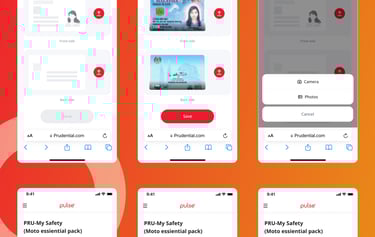
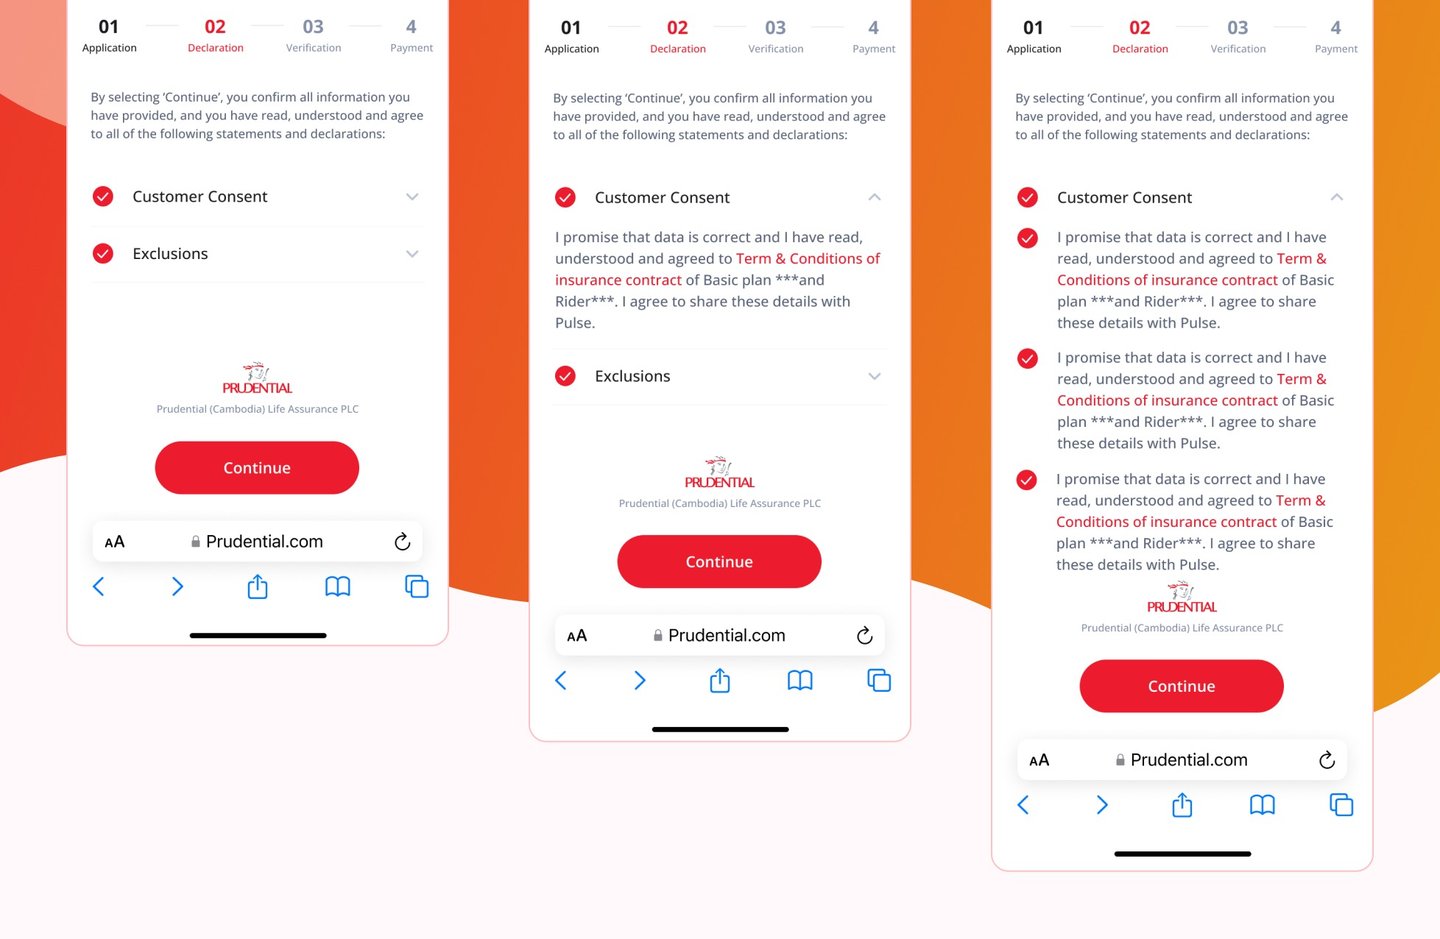
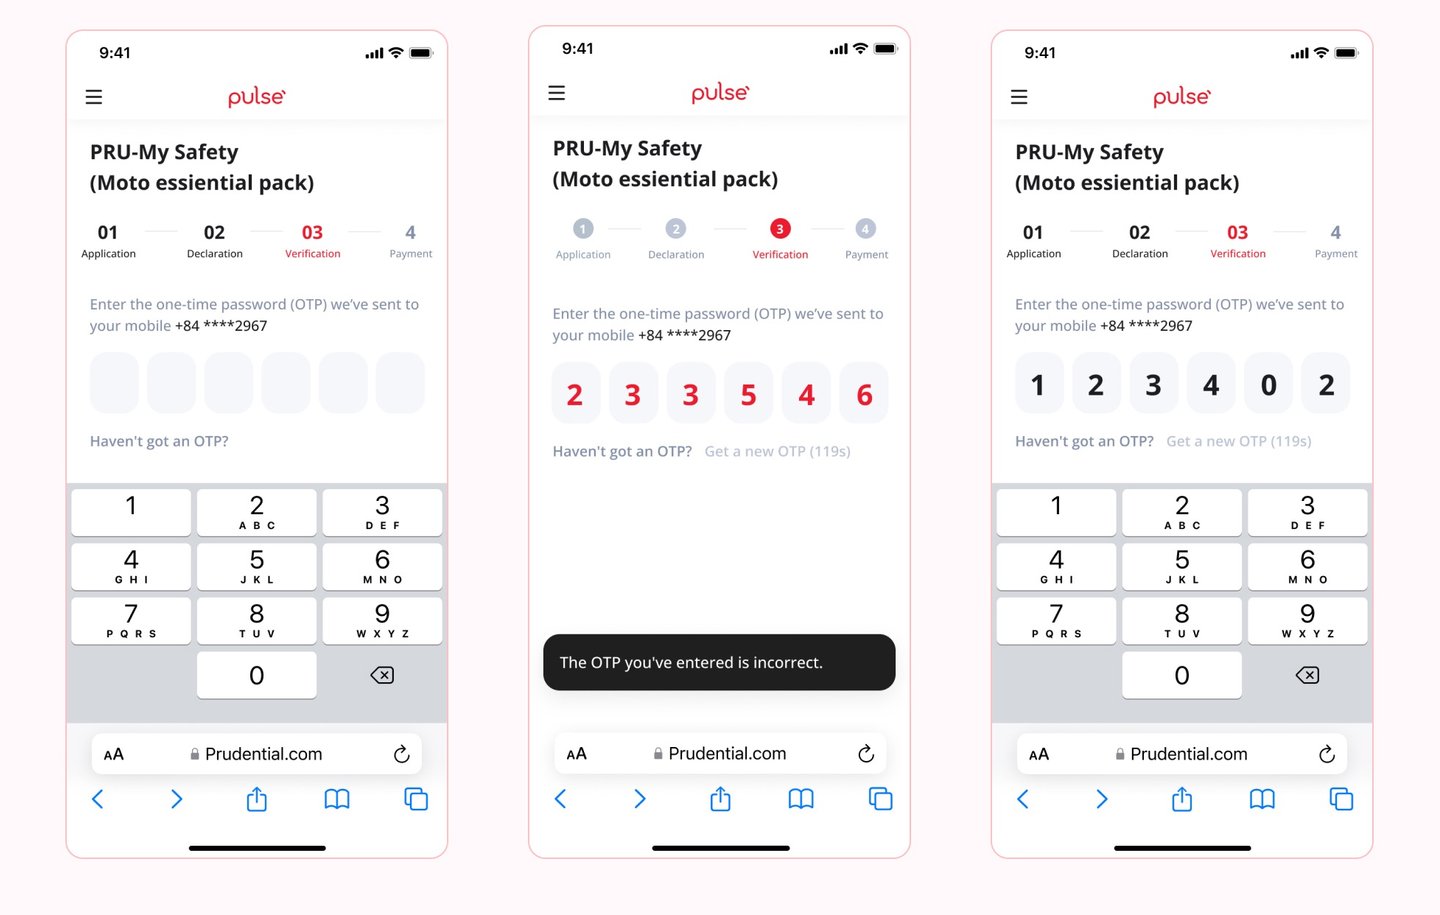
Preview of Customized Mobile View from the Insurance Product Configuration SaaS
Here’s how the tailored insurance product page will appear on mobile devices after customization using the platform.
Conclusion
Usability testing for Prudential Insurance Product Configuration provided valuable insights into user behavior, preferences, and pain points. By observing real users navigating the platform, we identified areas requiring improvement and validated design decisions.
Implementing the feedback from usability testing will ensure a more intuitive, user-friendly experience, empowering sales, marketing, and operations teams to manage insurance products efficiently. This iterative approach will contribute to higher user satisfaction, increased adoption, and improved business outcomes.
Continuous usability testing and refinement will further enhance the platform's effectiveness, supporting Prudential's goal of delivering a seamless and efficient insurance management experience.
Metrics to Measure Success
User Experience Metrics:
Task Completion Rate:
Input: Number of users completing product configuration tasks / Total number of users attempting tasks
Goal: >90% completion rateTime on Task:
Input: Total time taken for configuration tasks / Number of tasks completed
Goal: Reduce time by 30% within 6 monthsError Rate:
Input: Number of configuration errors / Total configuration attempts
Goal: <5% error rateUser Satisfaction (CSAT):
Input: Survey score from users (1-5 or 1-10) post-configuration
Goal: Achieve a CSAT score of 4.5 or above
Business Impact Metrics:
Time to Market:
Input: Average time from product configuration to launch
Goal: Reduce time to market by 40% within a yearSales Conversion Rate:
Input: Number of sales through configured product pages / Total visits to product pages
Goal: Increase conversion rate by 20%Product Launches:
Input: Number of products configured and launched per quarter
Goal: 10-15 product launches per quarterOperational Efficiency:
Input: Reduction in manual tasks reported by teams
Goal: Achieve 50% reduction in manual work
Adoption & Engagement Metrics:
Active User Rate:
Input: Number of active users per month / Total registered users
Goal: Maintain an 80% active user rateFeature Utilization:
Input: Frequency of feature use (e.g., banner upload, sales rule configuration)
Goal: Ensure 70% of users engage with core features weeklyTraining Completion:
Input: Number of users completing training / Total enrolled users
Goal: 90% training completion rate within the first 30 days
Performance Metrics:
System Uptime:
Input: Total uptime hours / Total operational hours
Goal: 99.9% uptimePage Load Time:
Input: Average time for a page to load (measured in seconds)
Goal: <2 seconds per pageIssue Resolution Time:
Input: Average time taken to resolve user-reported issues
Goal: Resolve 90% of issues within 24 hours